Project 4. Part 2, Cambodia (using adm2 data)
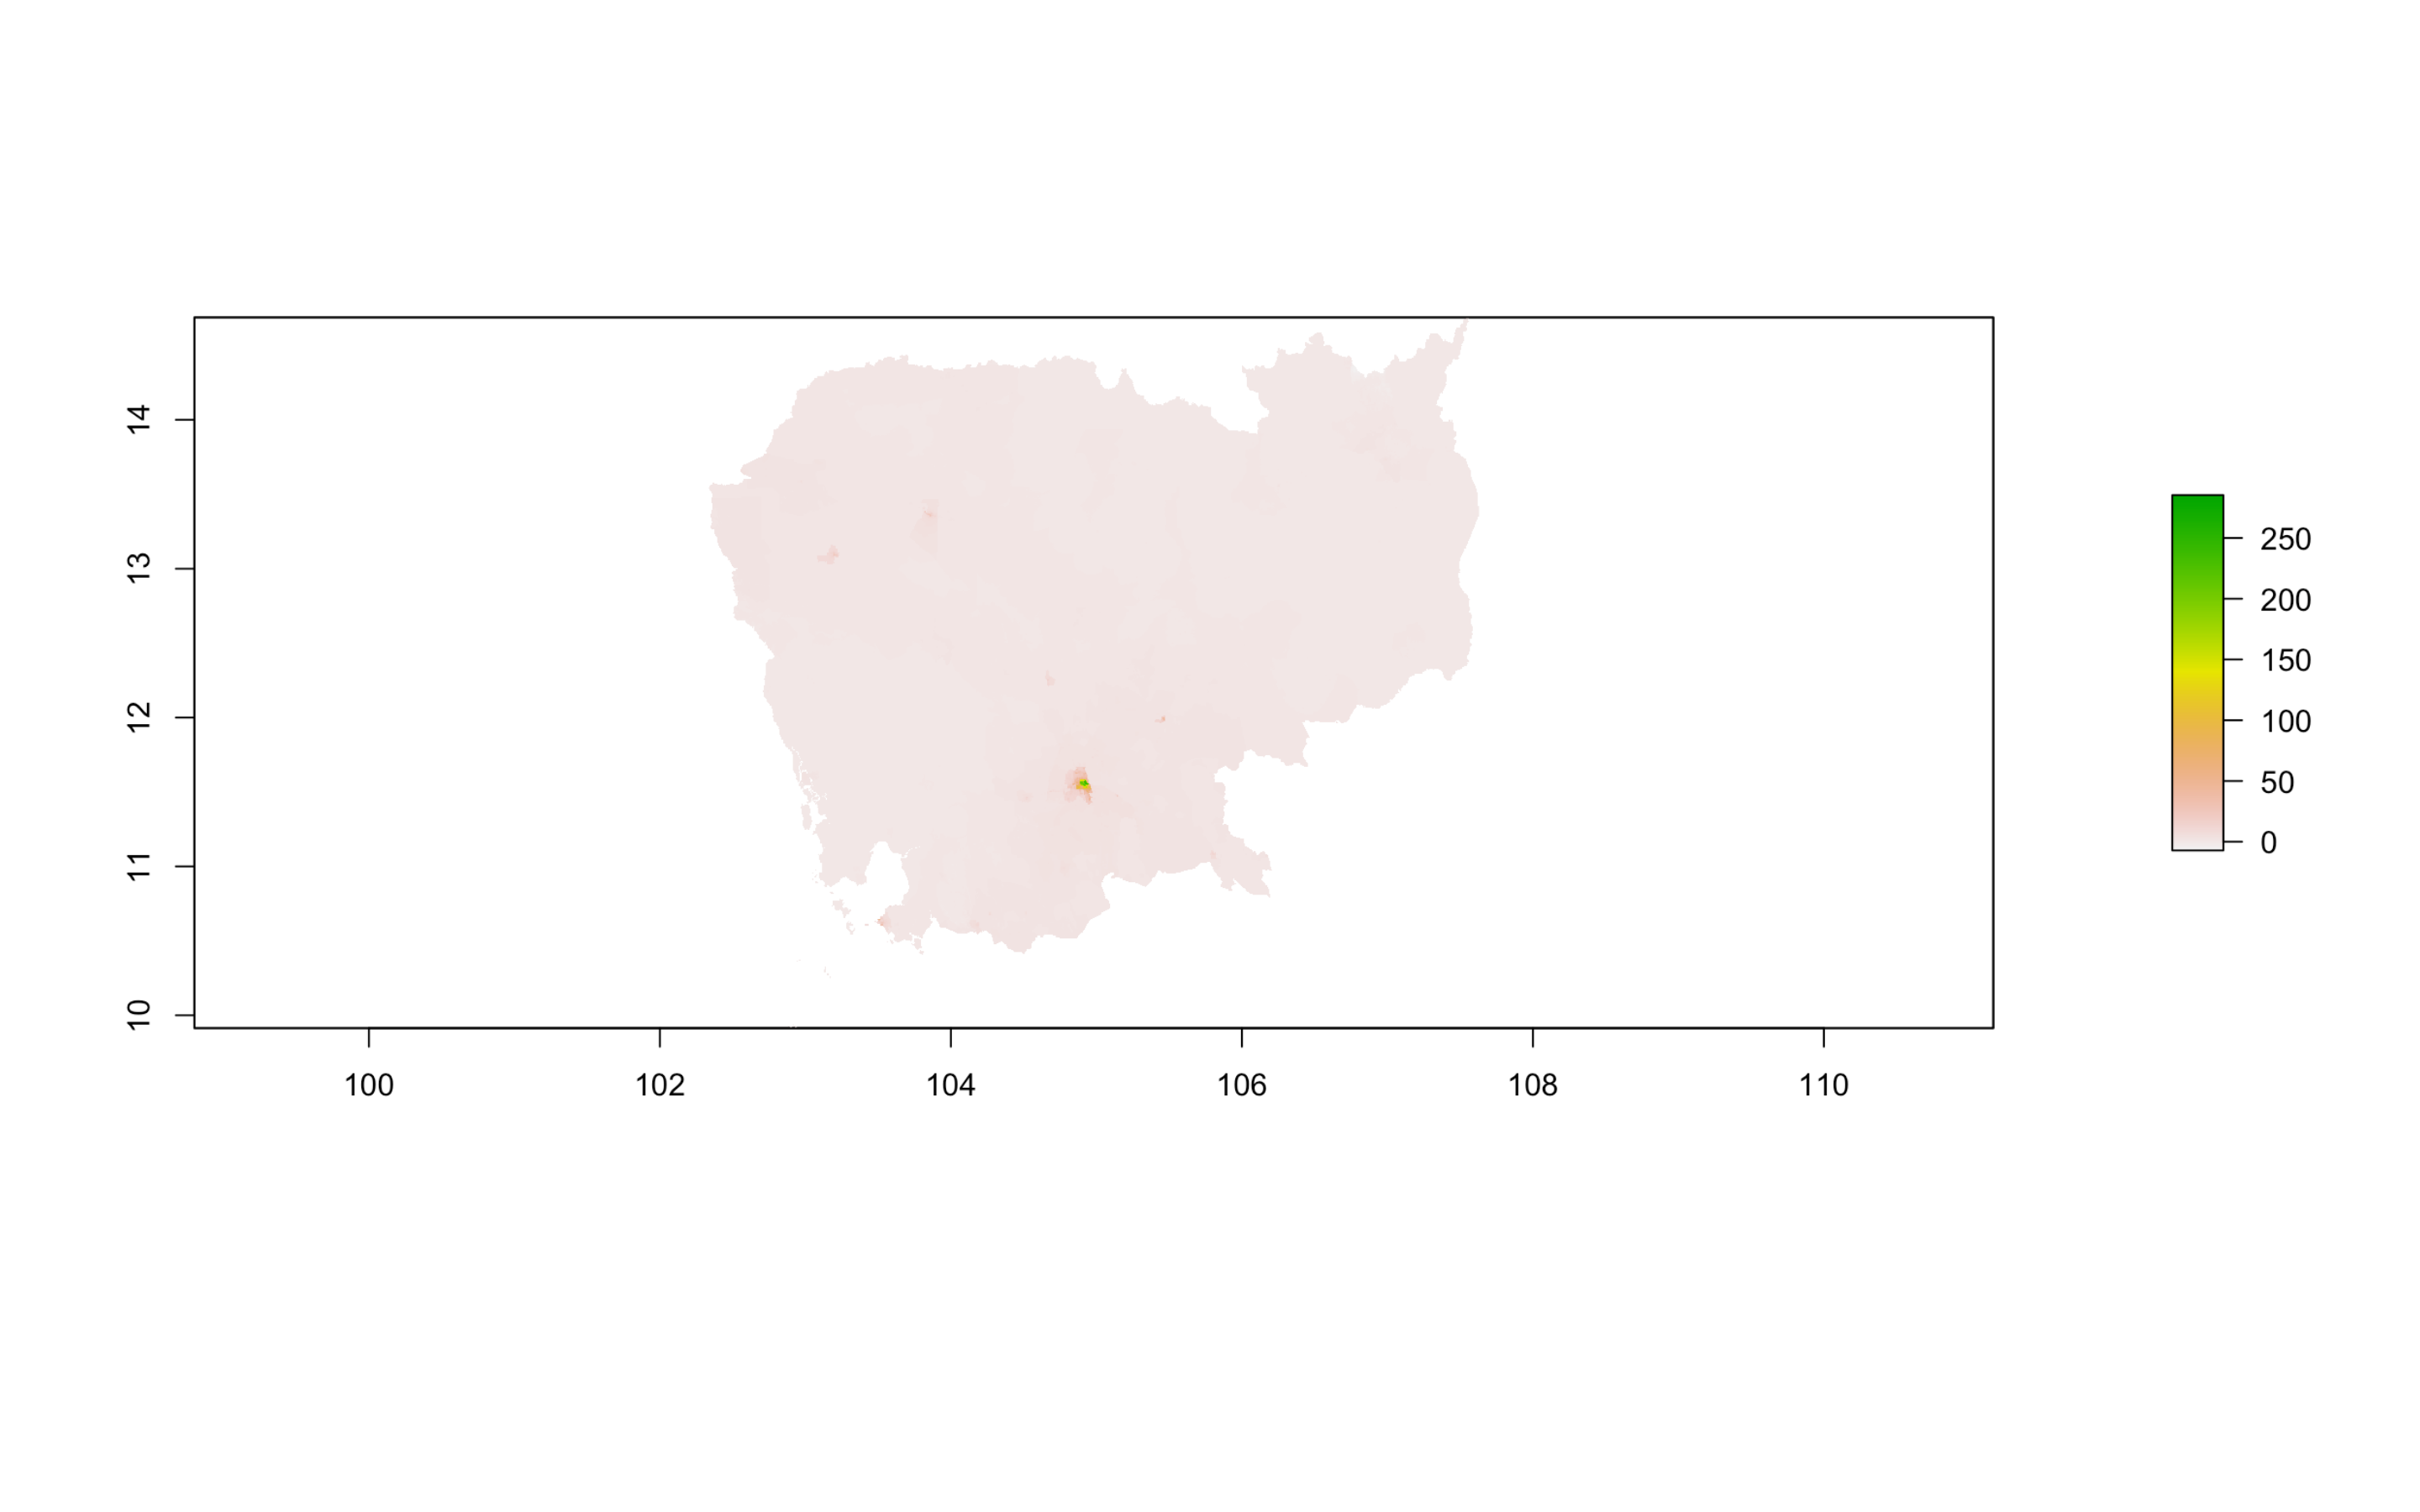
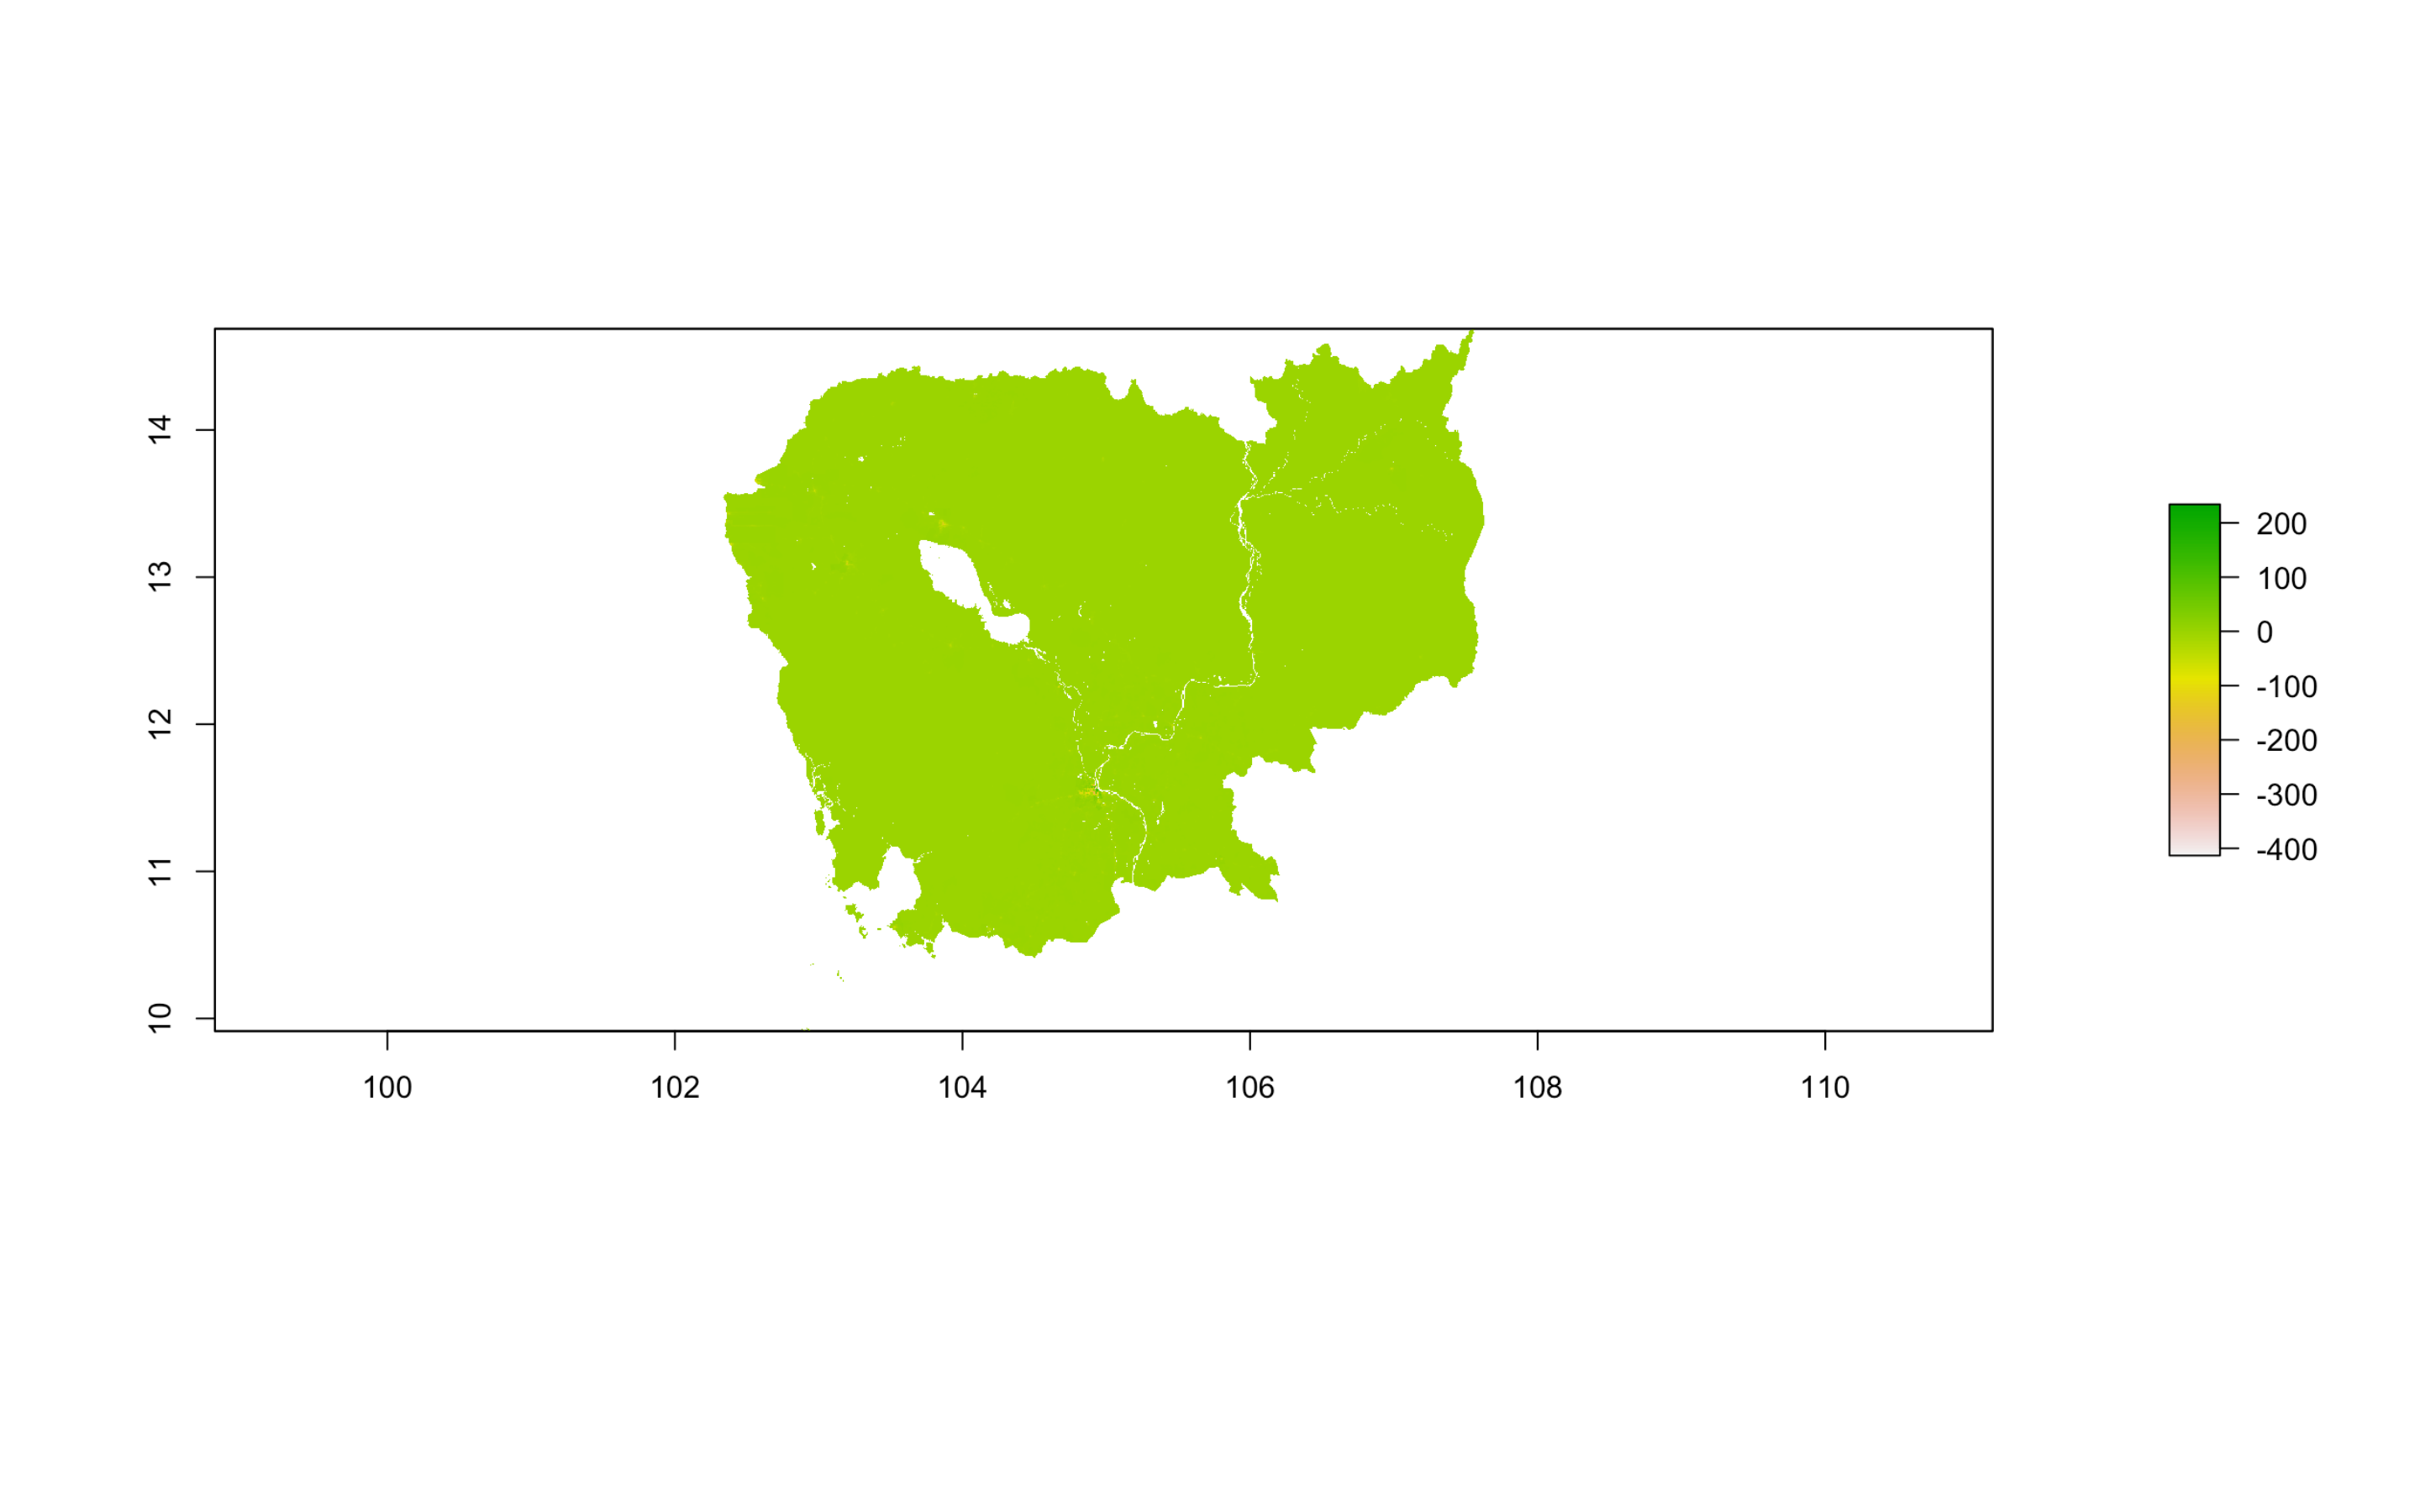
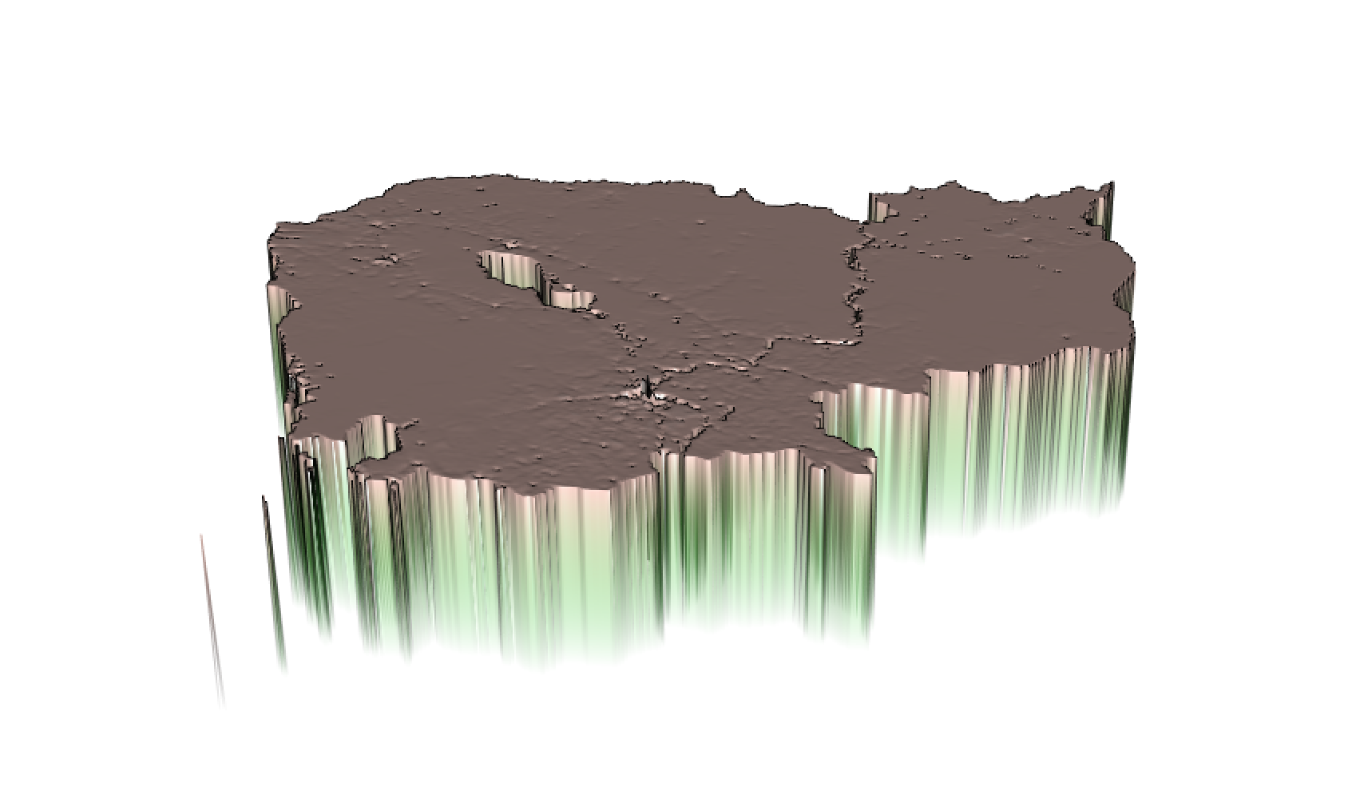
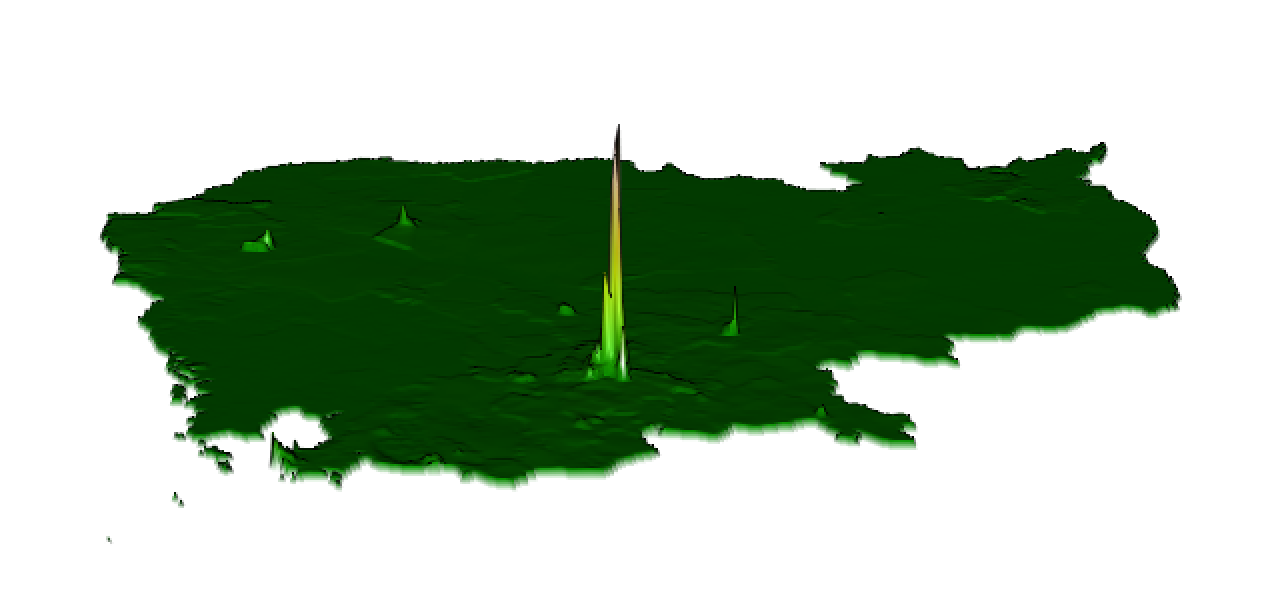
Sums:
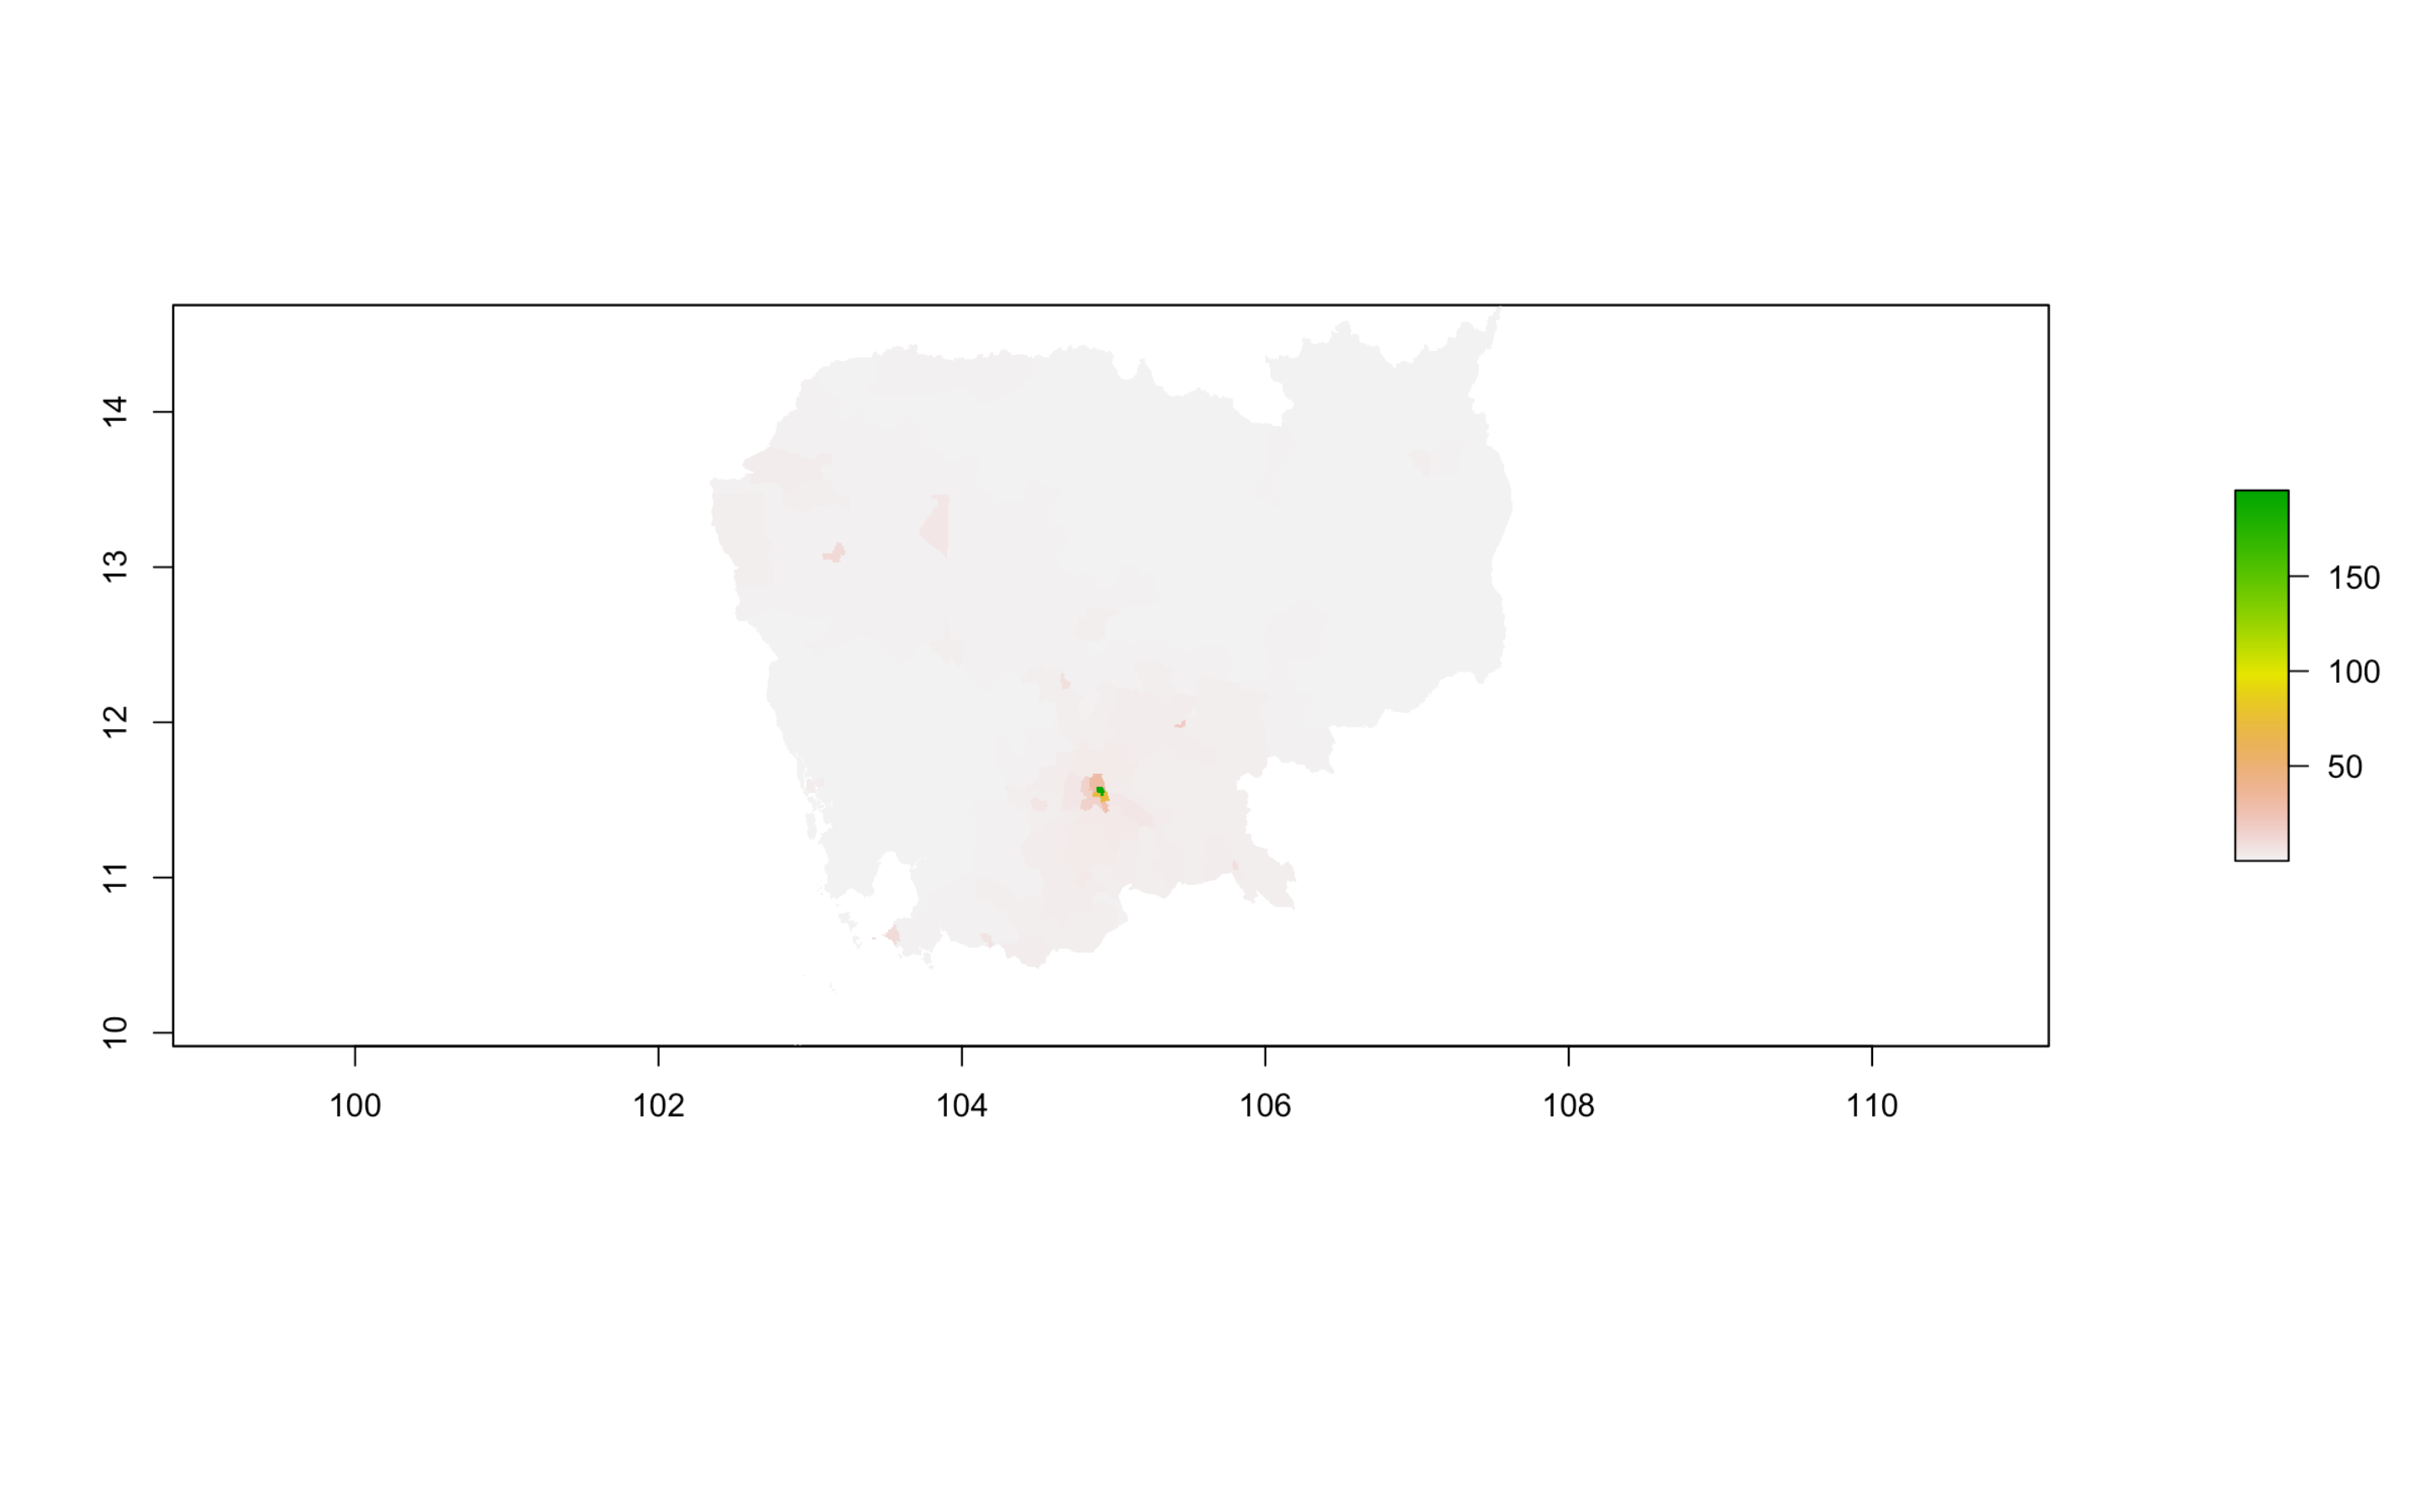
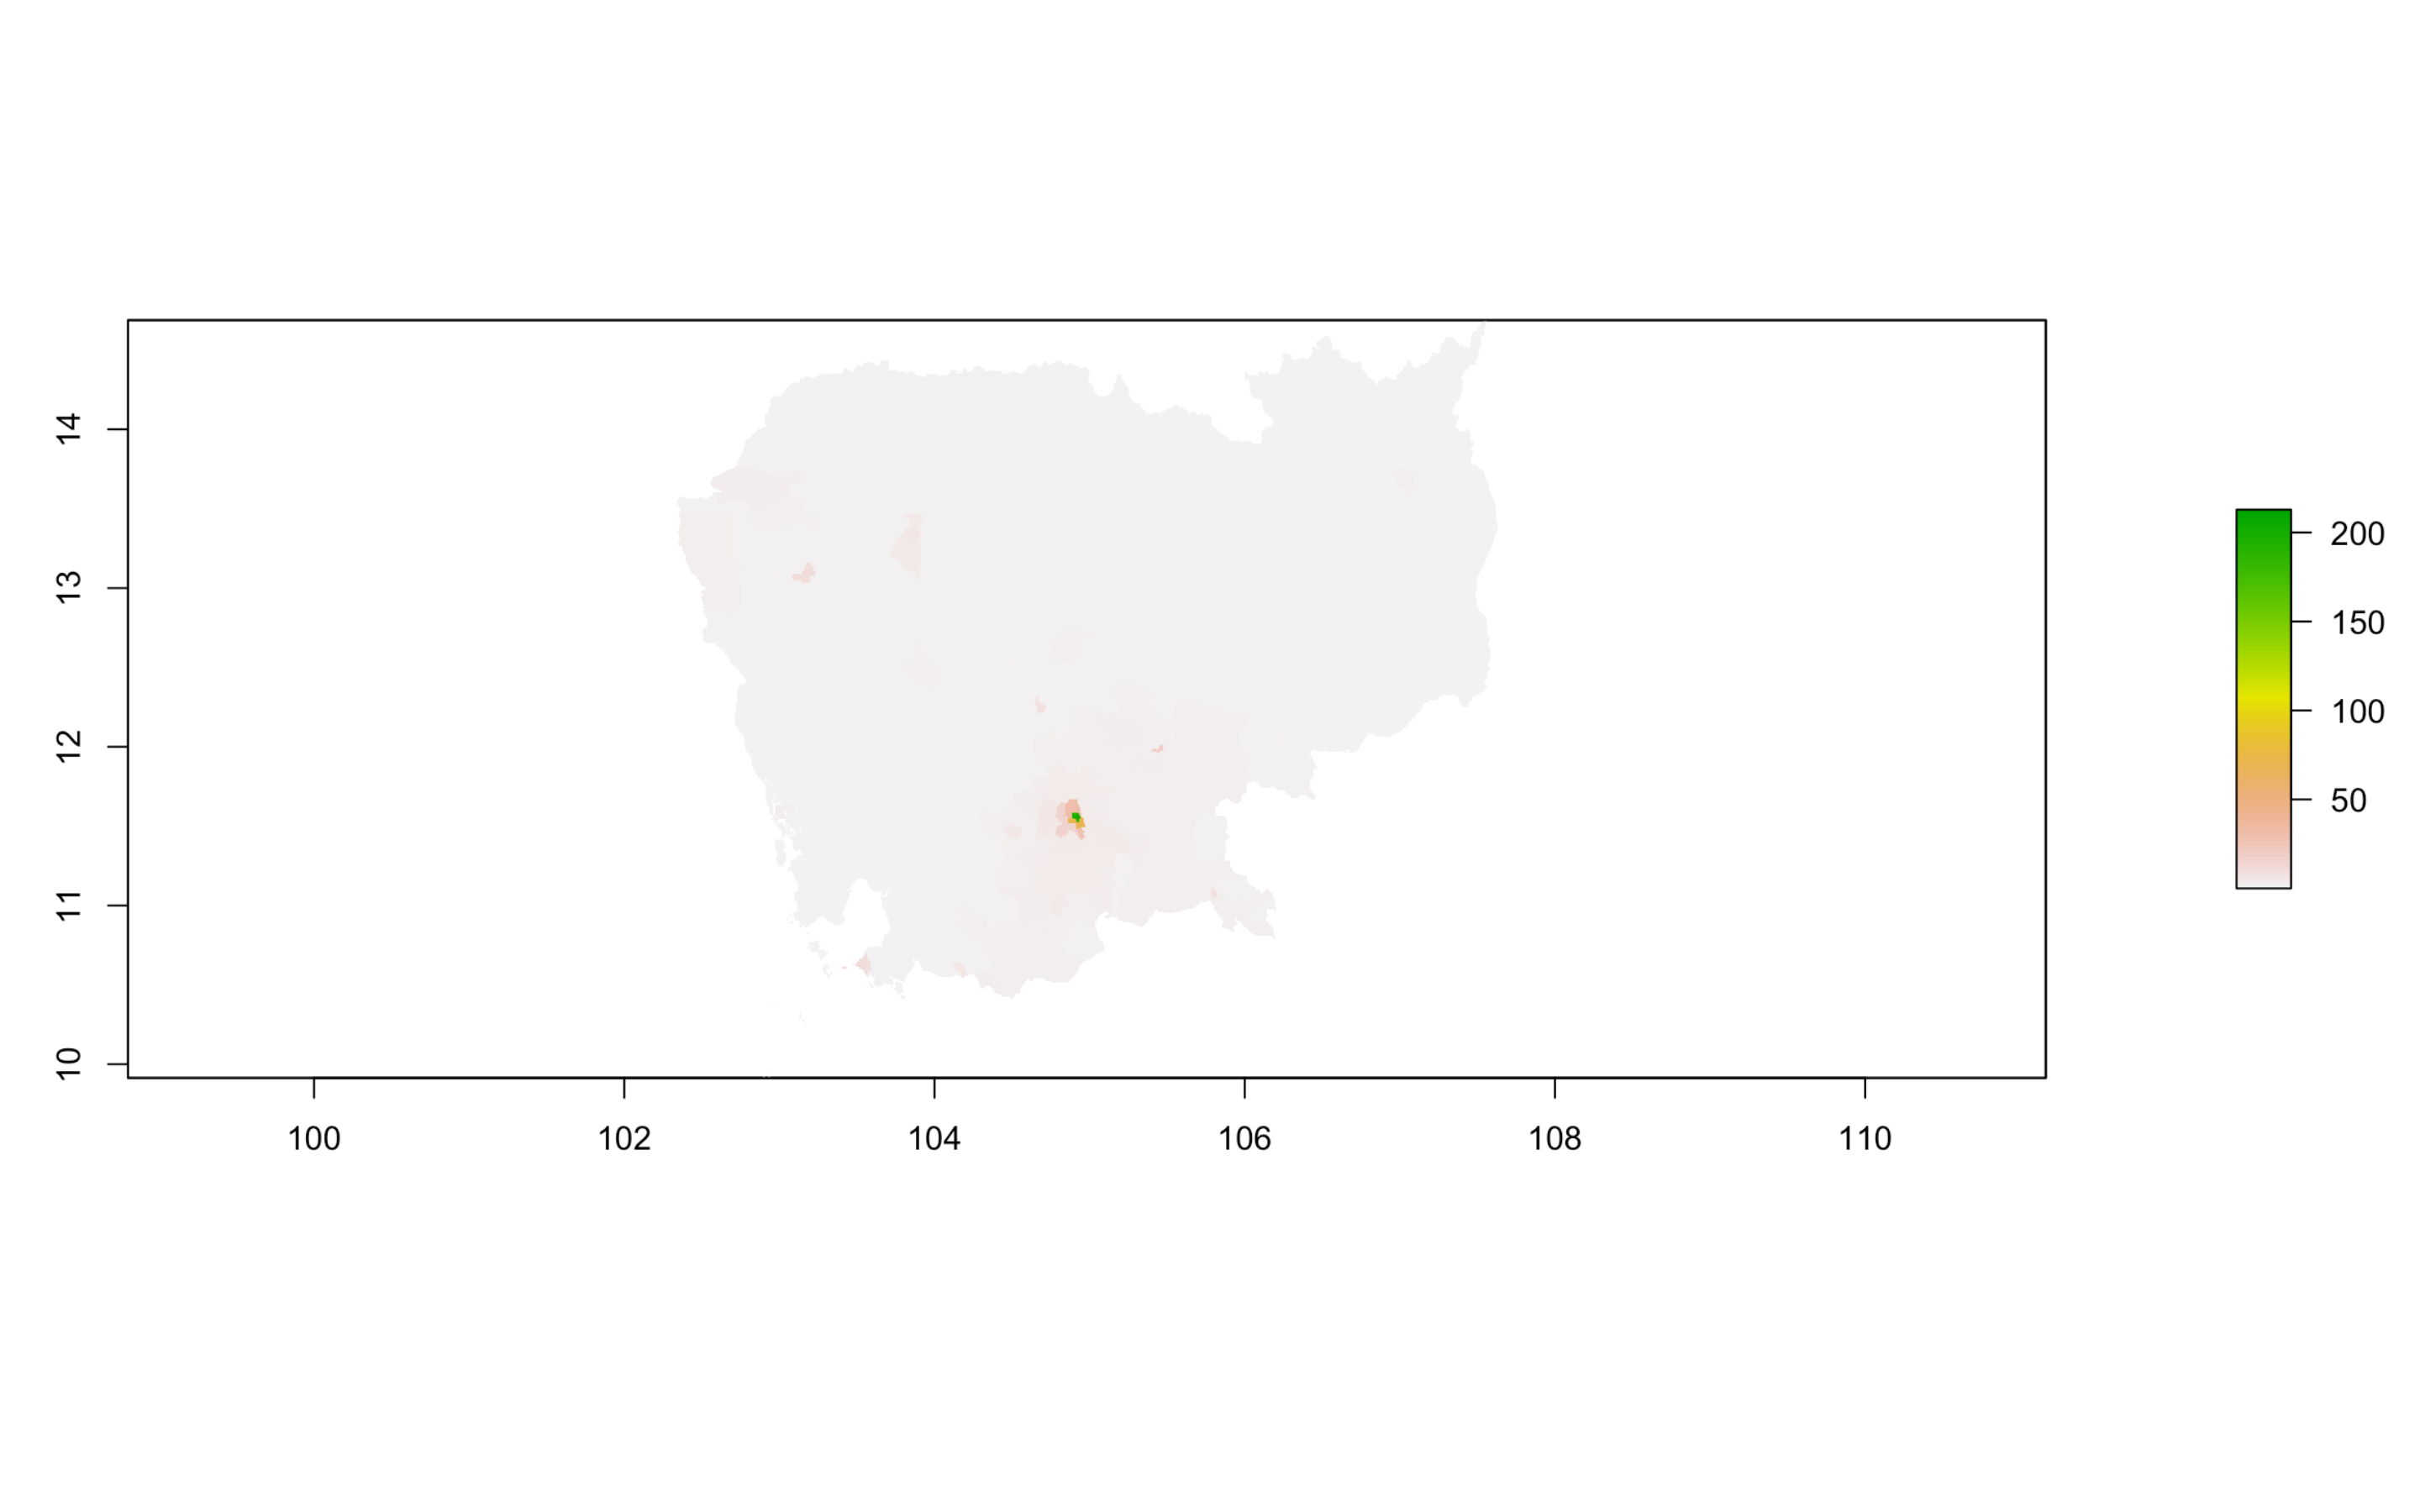
Predicted population of Cambodia:
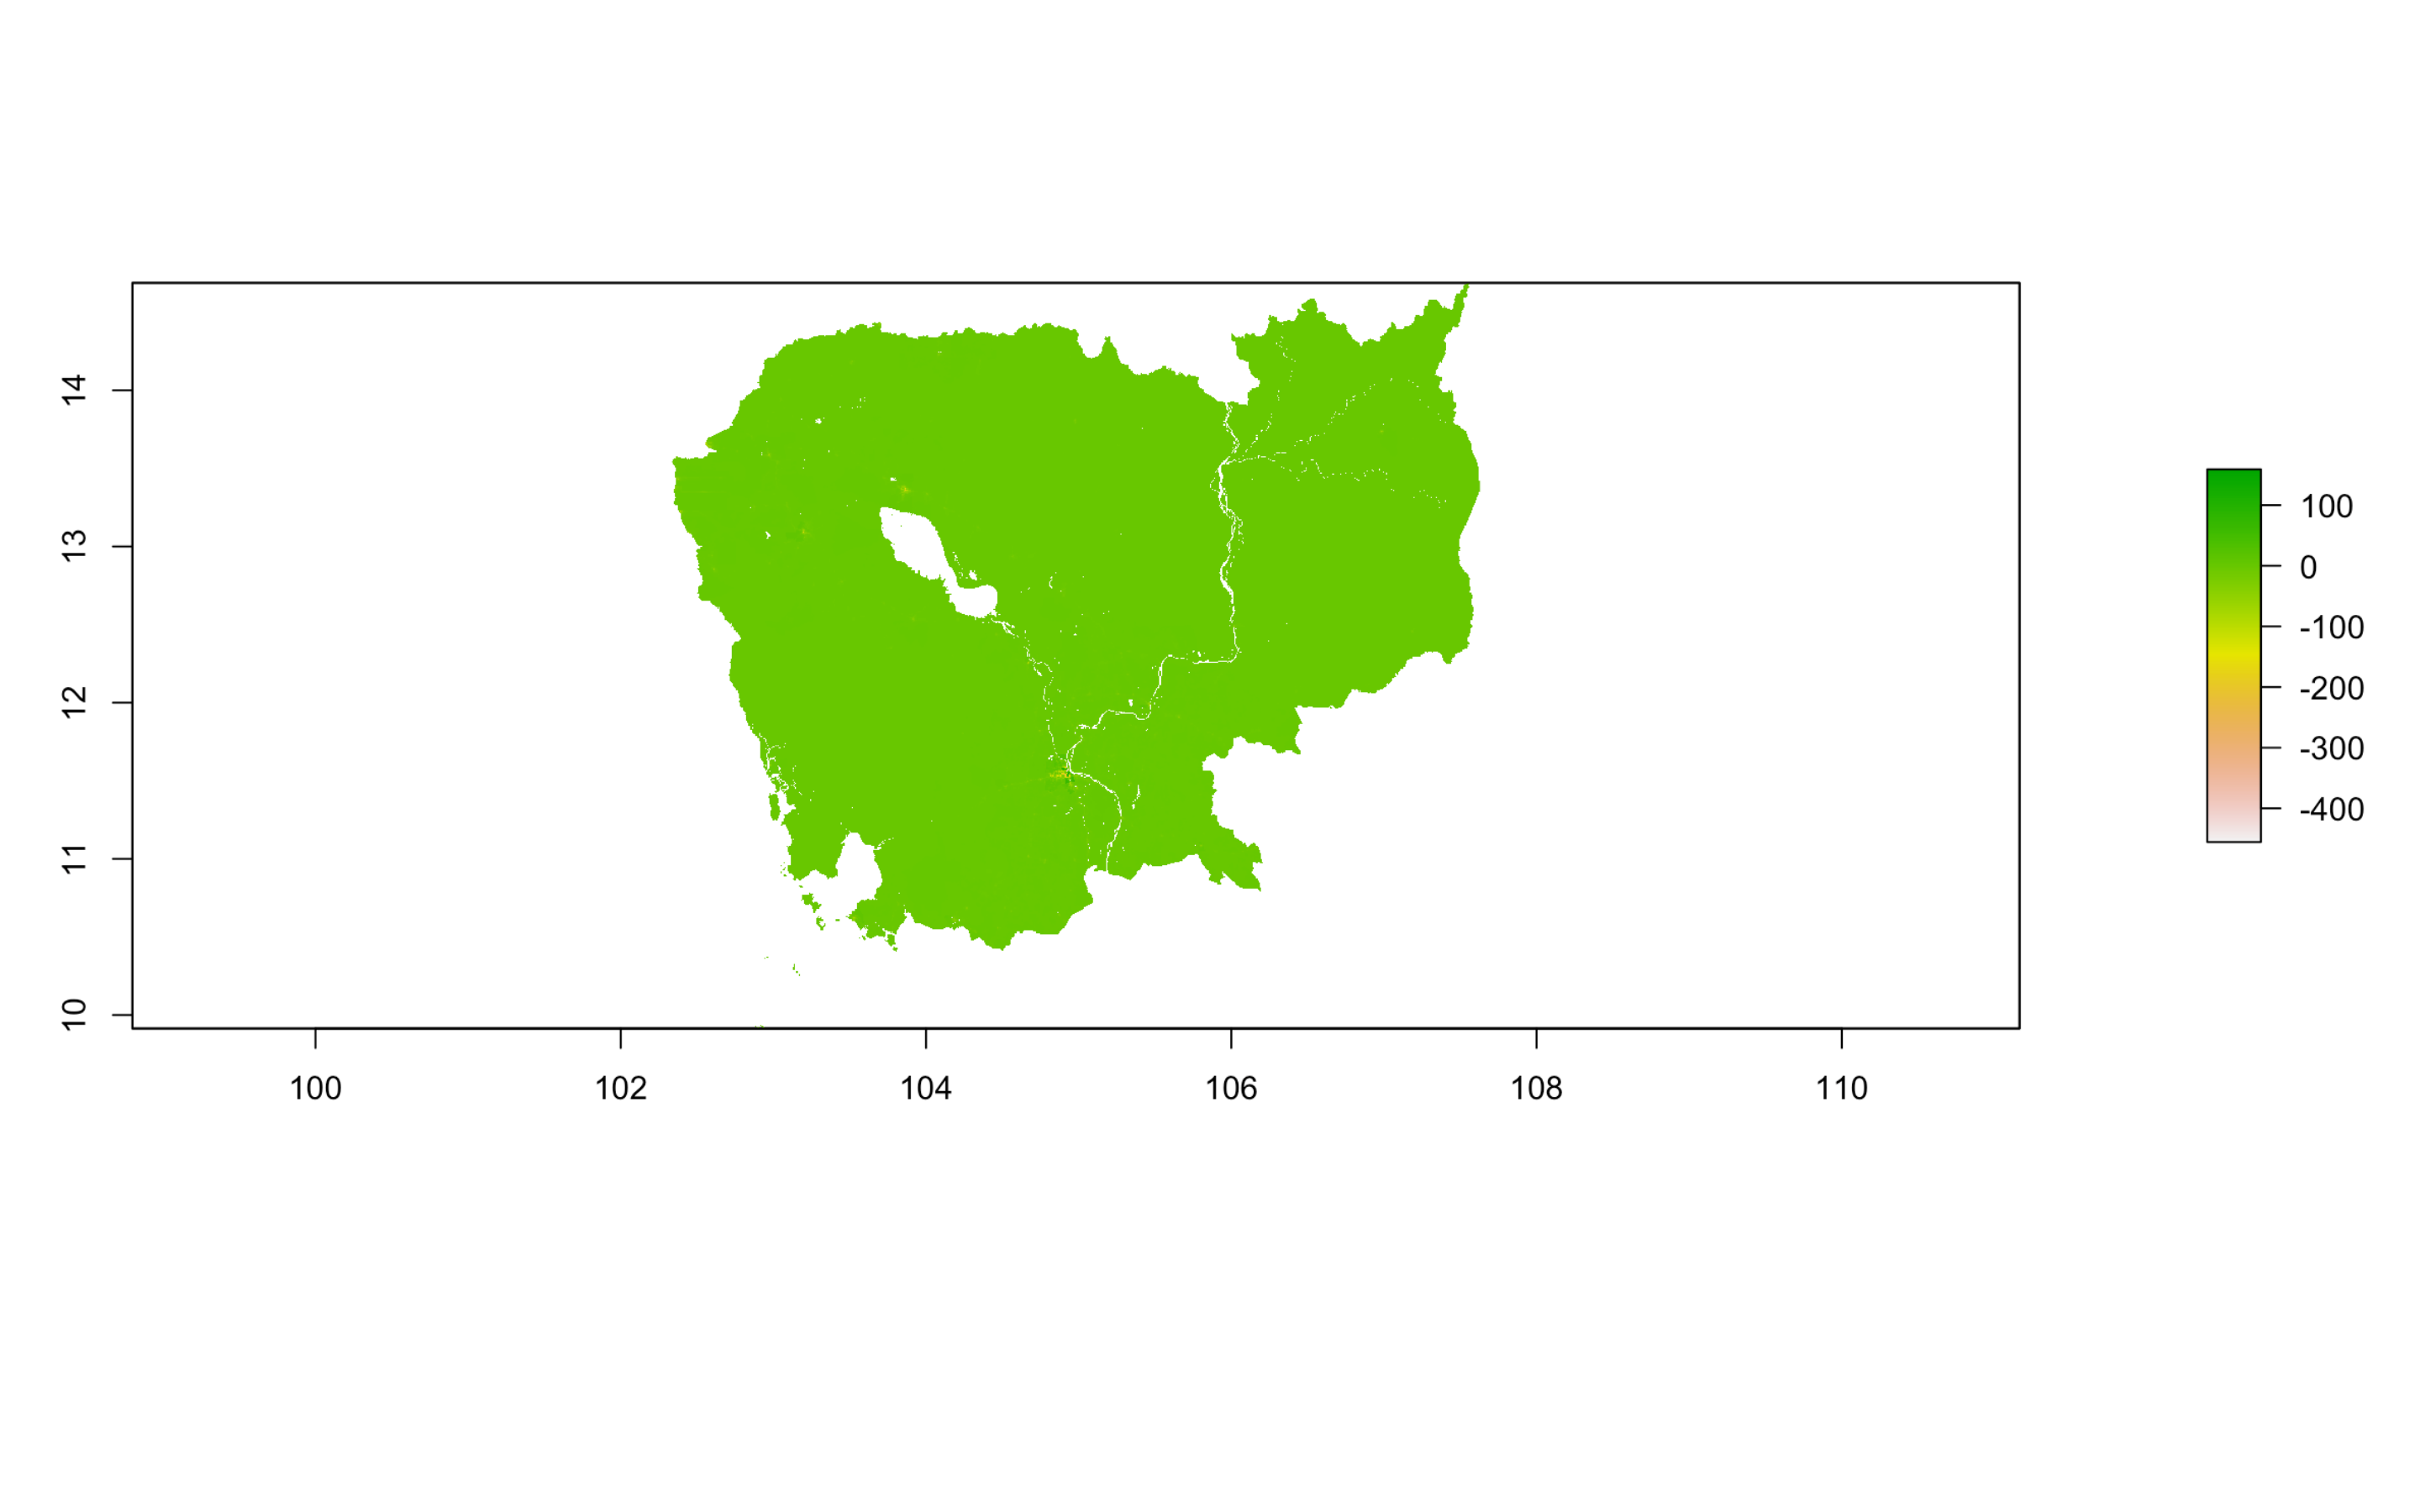
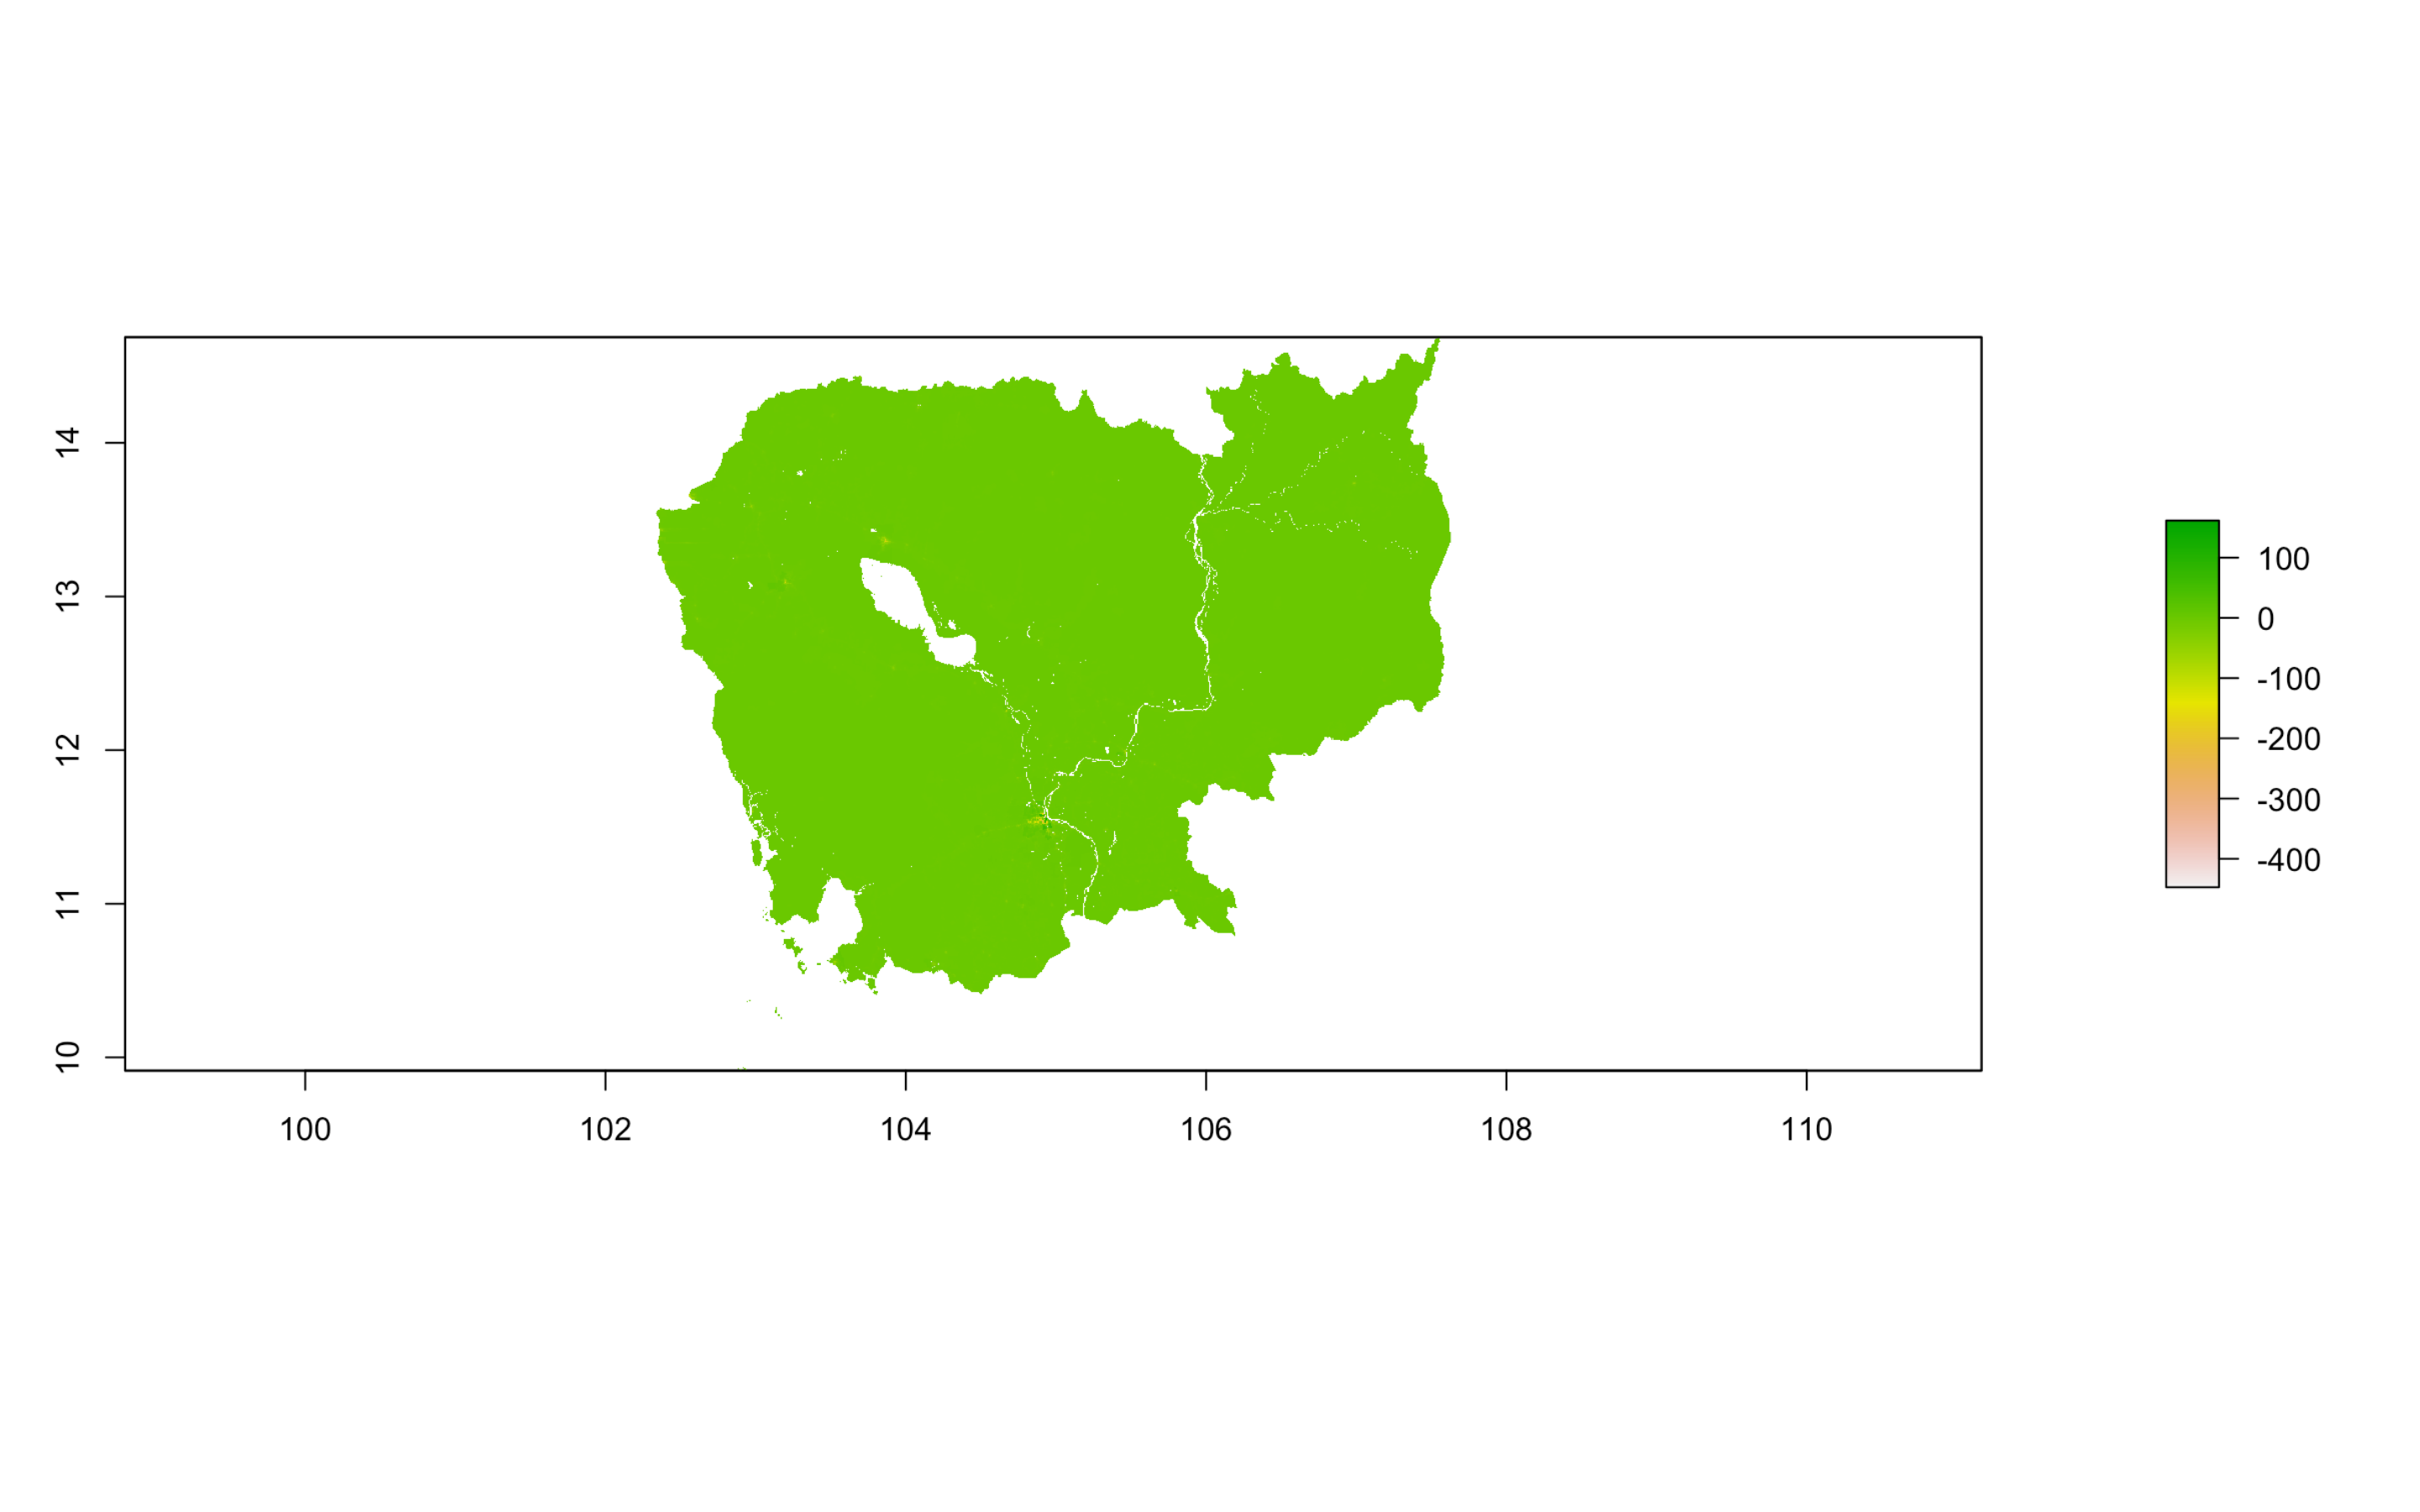
Difference between predicted results and 2015 WorldPop estimates:
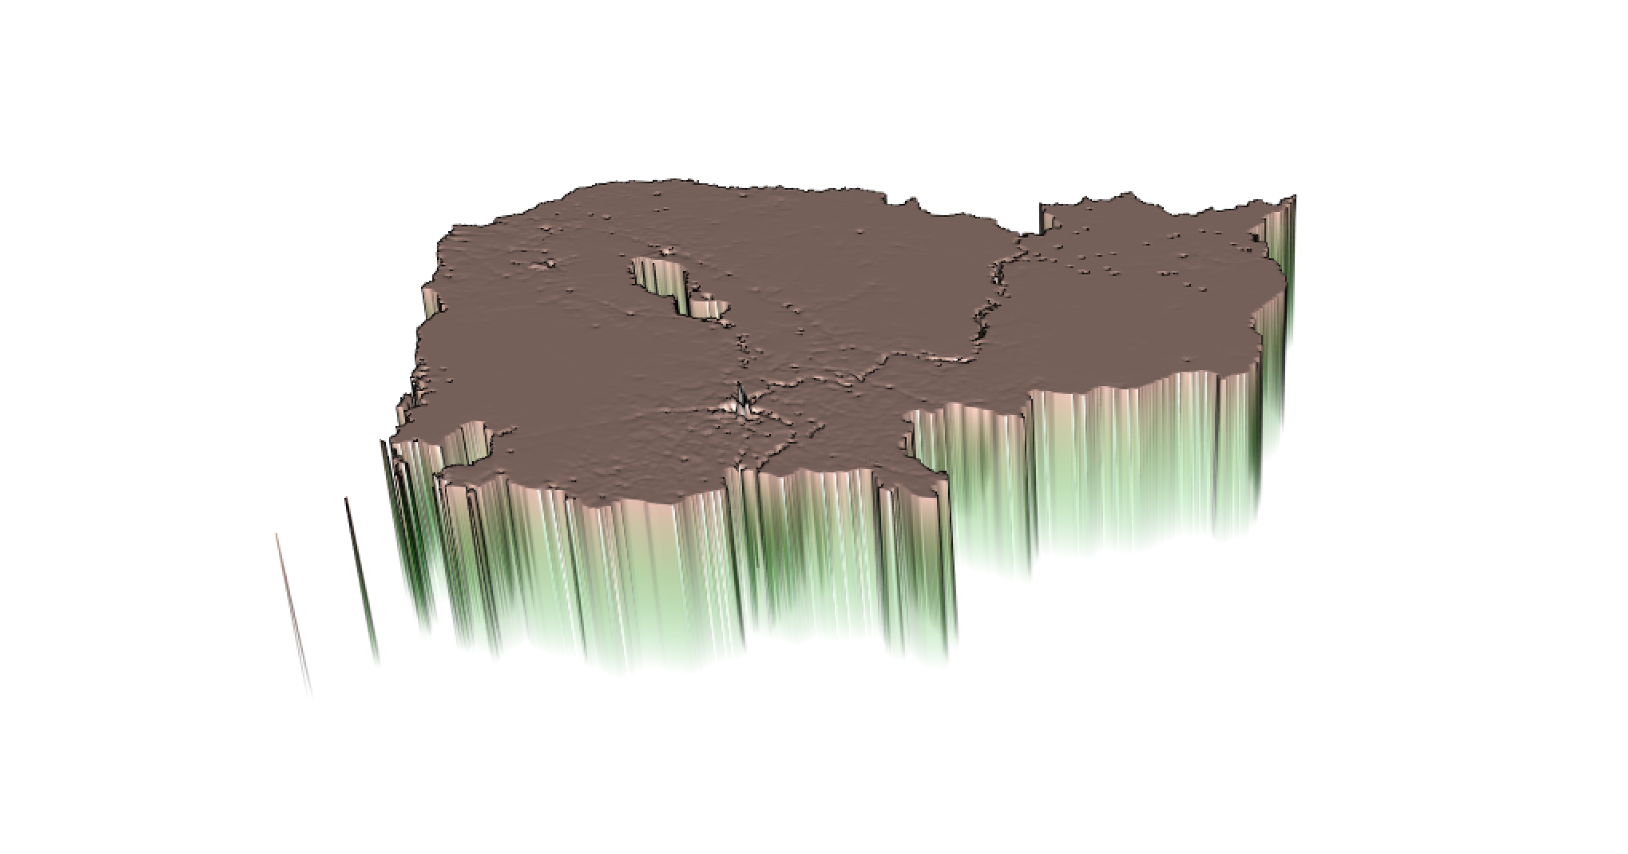
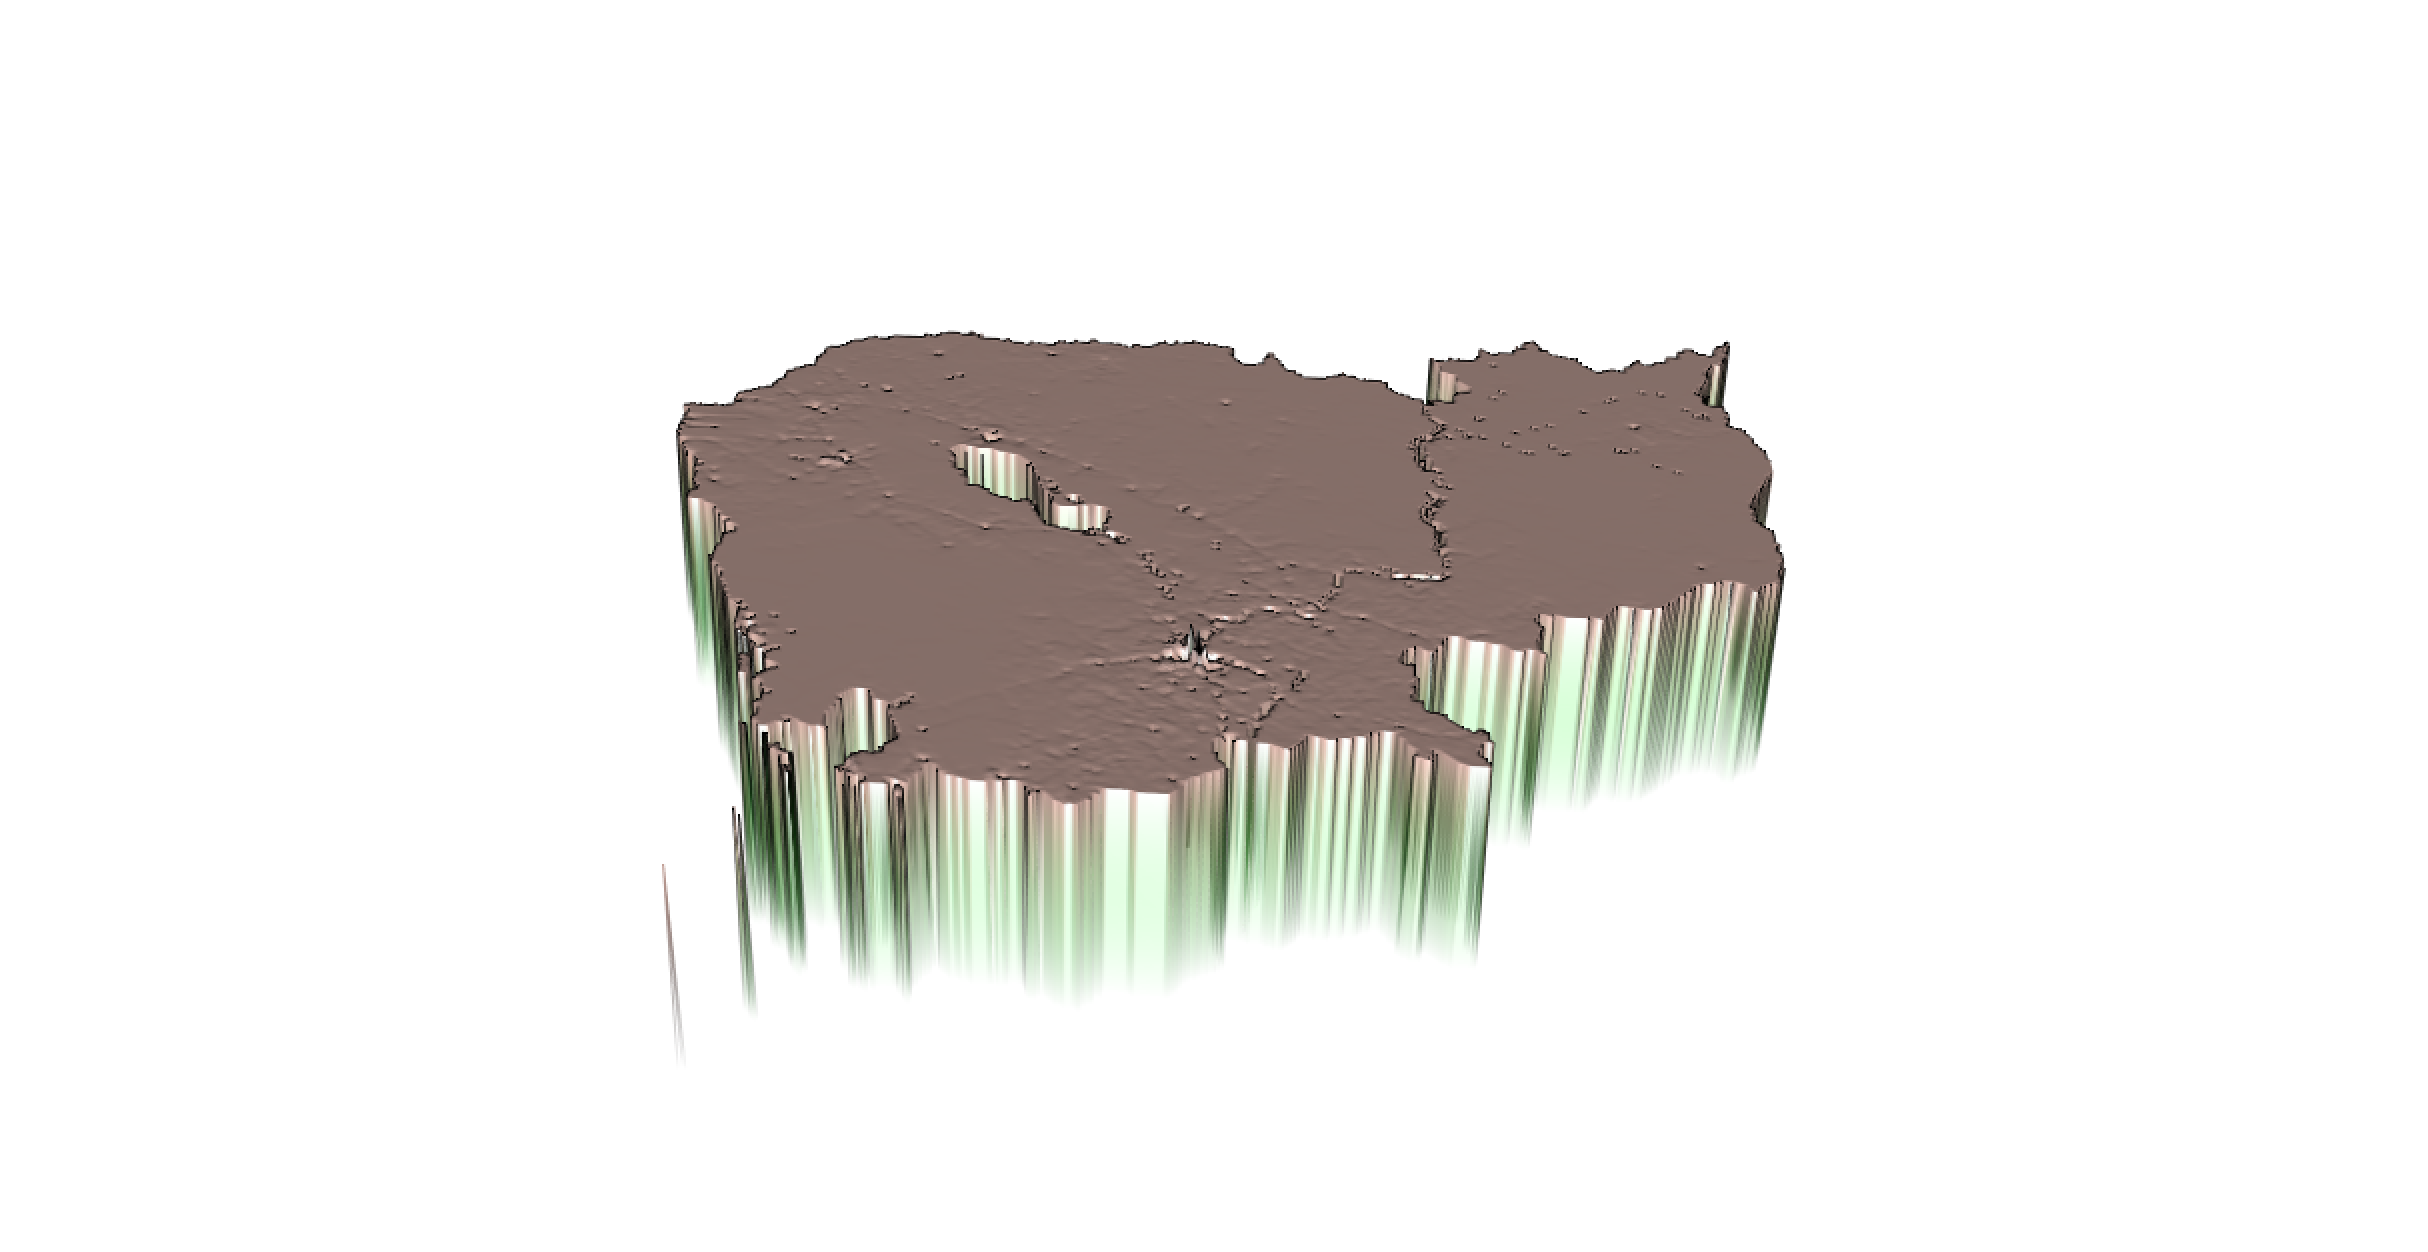
3D plot of difference:
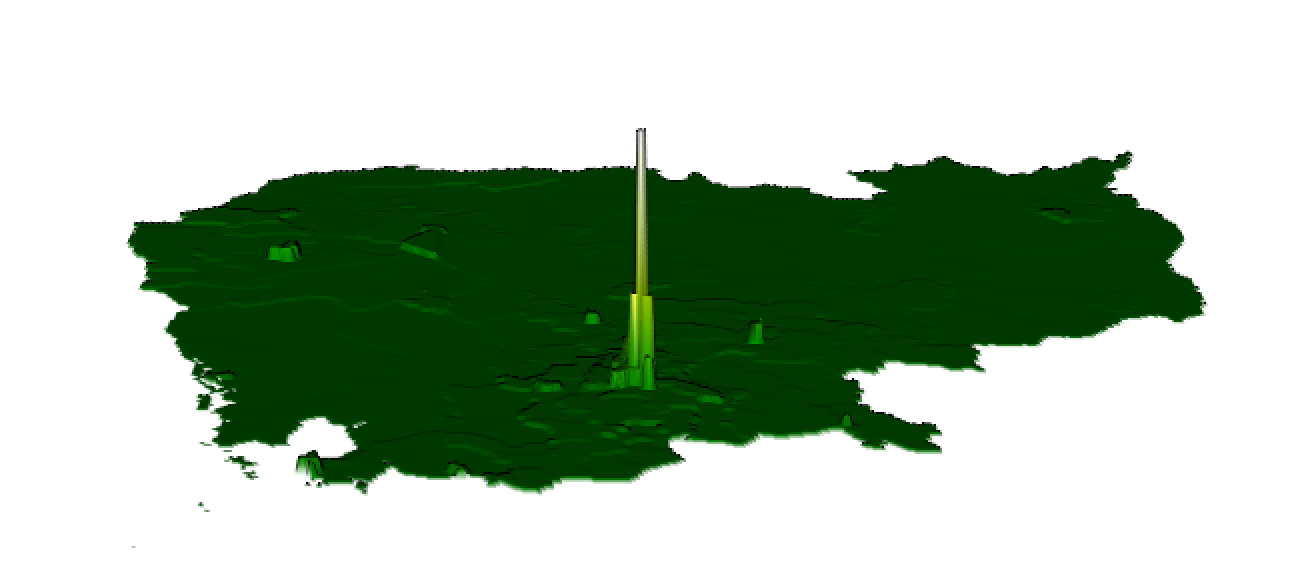
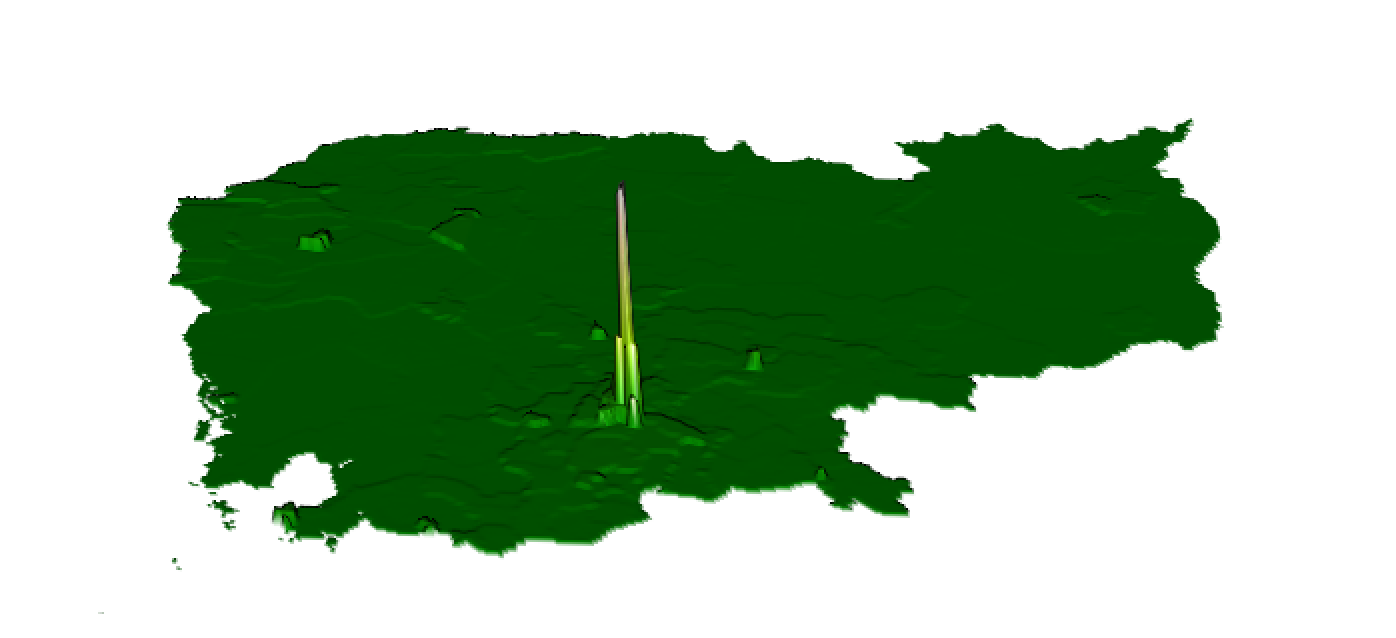
3D plot of population:
Means:
Predicted population of Cambodia:
Difference between predicted results and 2015 WorldPop estimates:
3D plot of difference:
3D plot of population:
Logsum:
Predicted population of Cambodia:
Difference between predicted results and 2015 WorldPop estimates:
3D plot of difference:
3D plot of population:
Conclusion:
Based off of the above plots, I can assume that the model using mean data produced the most accurate results. The mean plot for “Difference between predicted results and 2015 WorldPop estimates” is closer to zero than that of sum and logsum. Thus, I can infer that while each of the models may have been somewhat flawed, the mean plots may have had the least amount of differences.