Skip to the content.
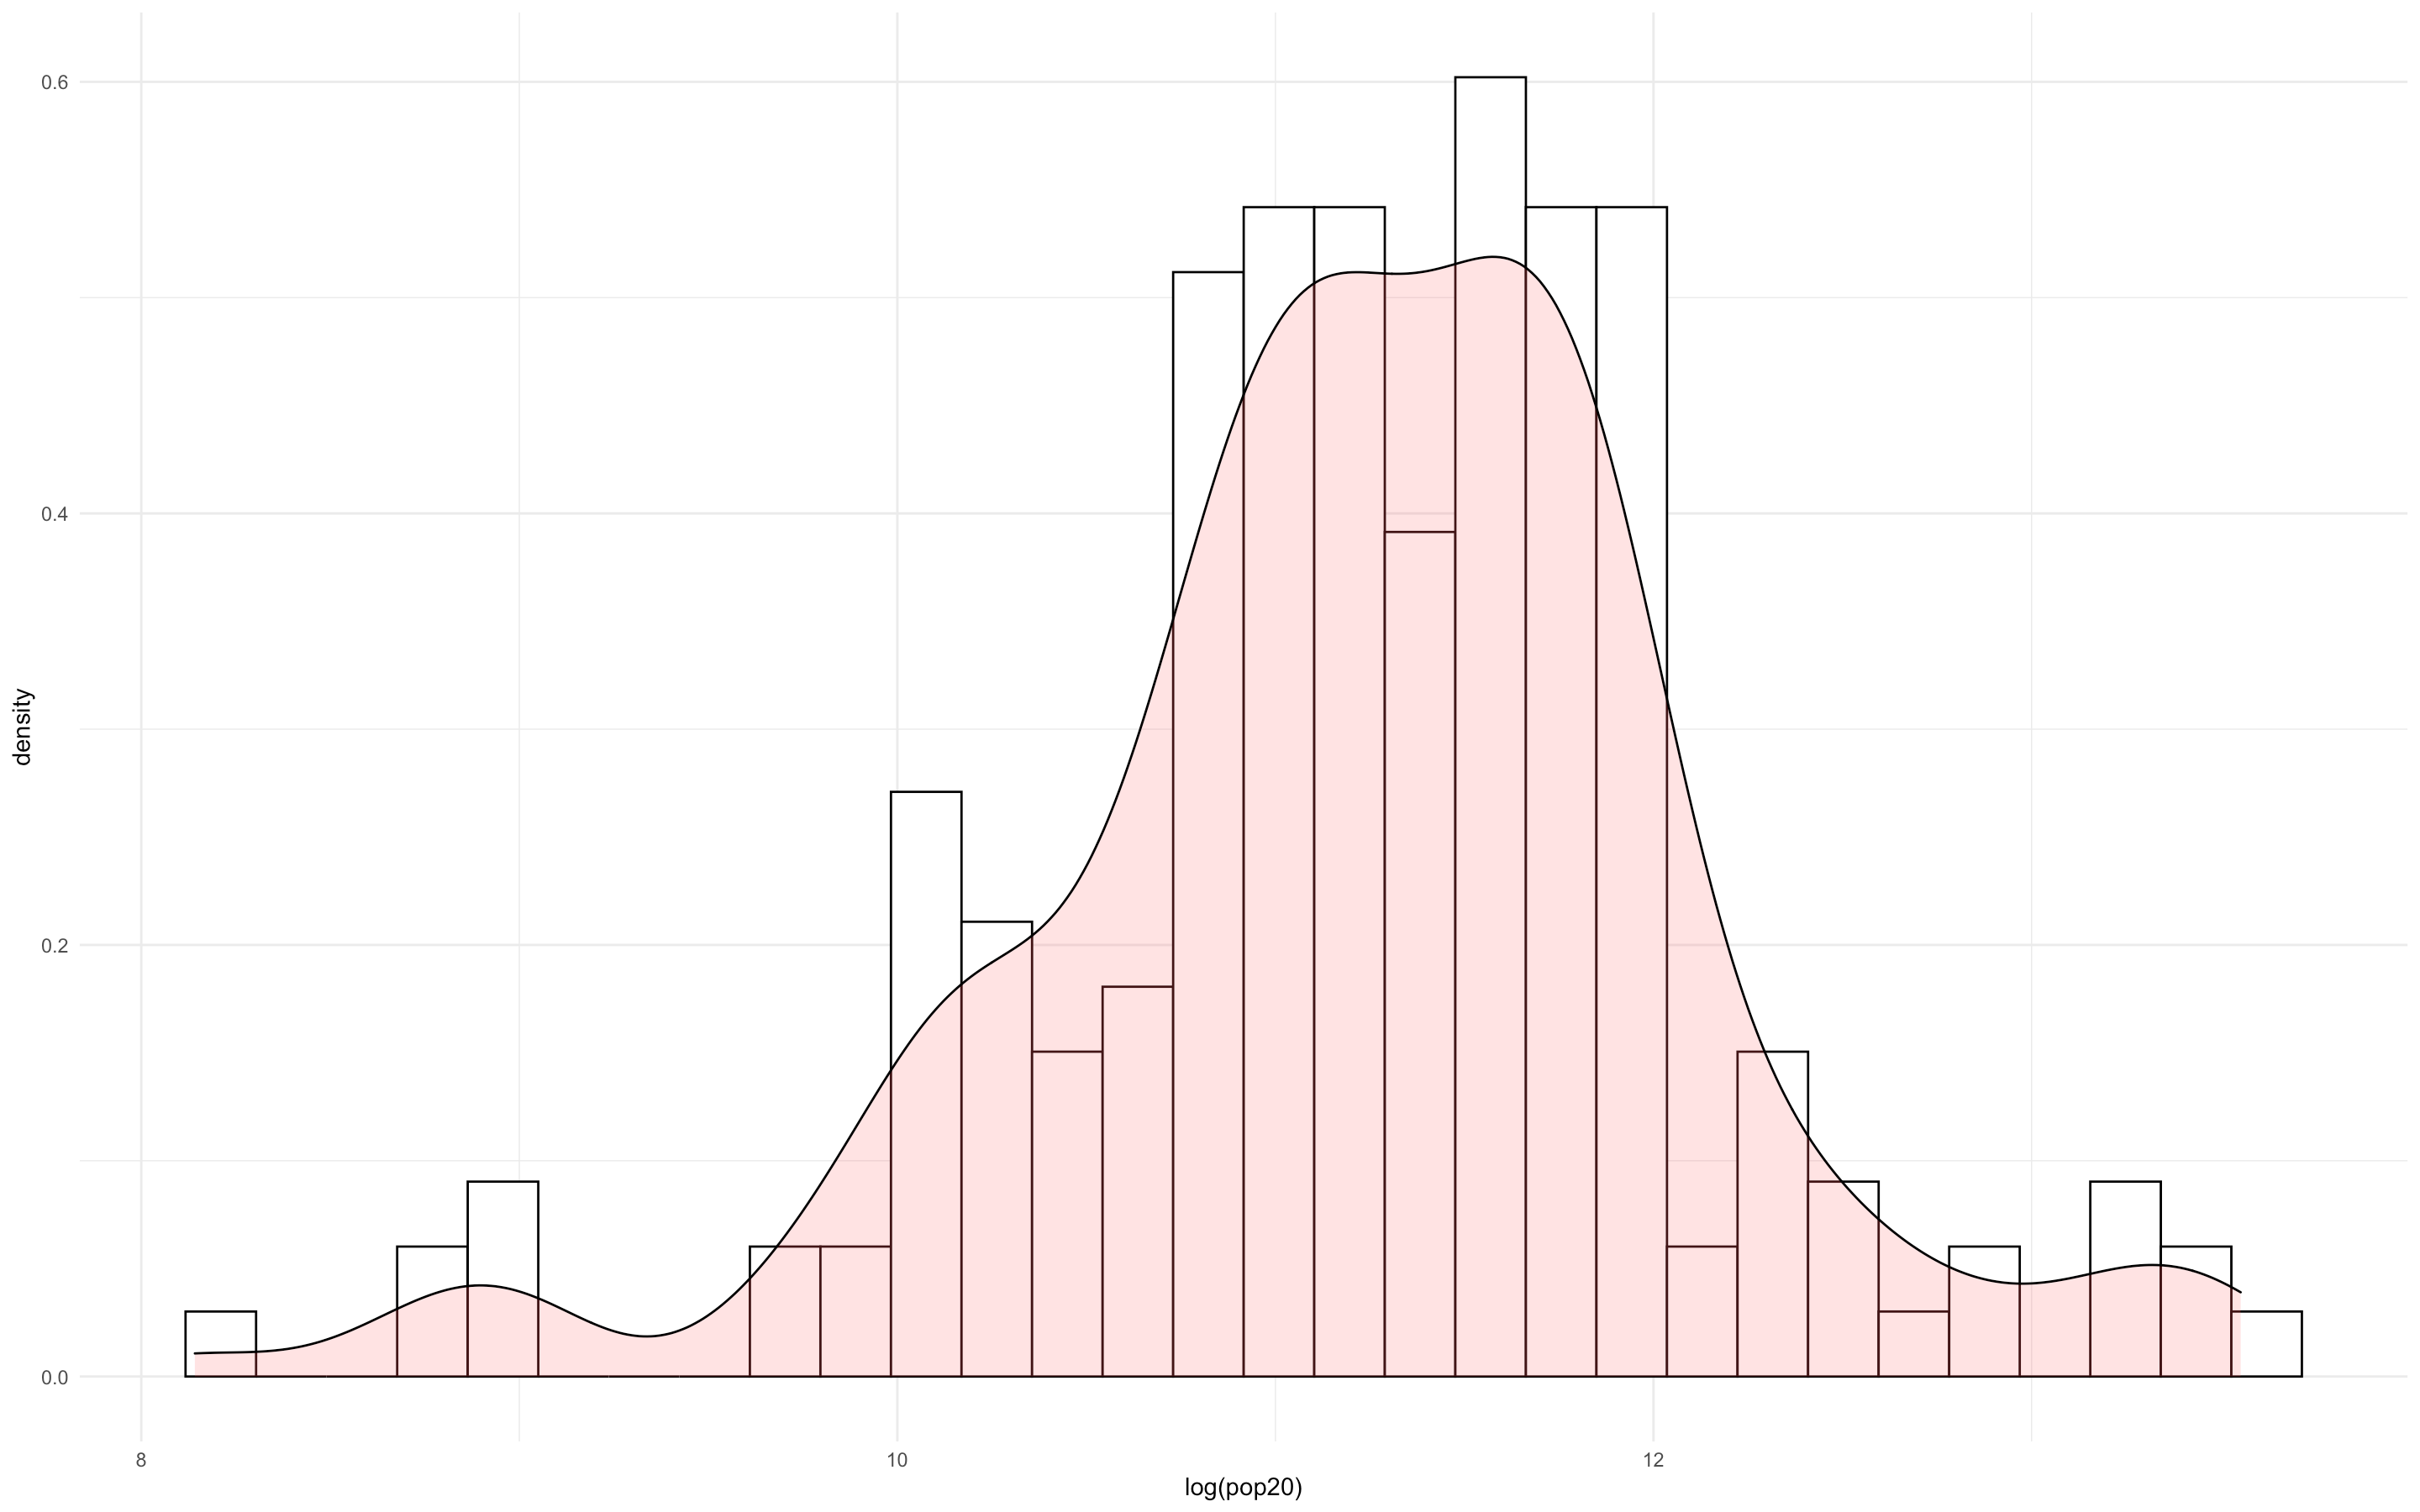
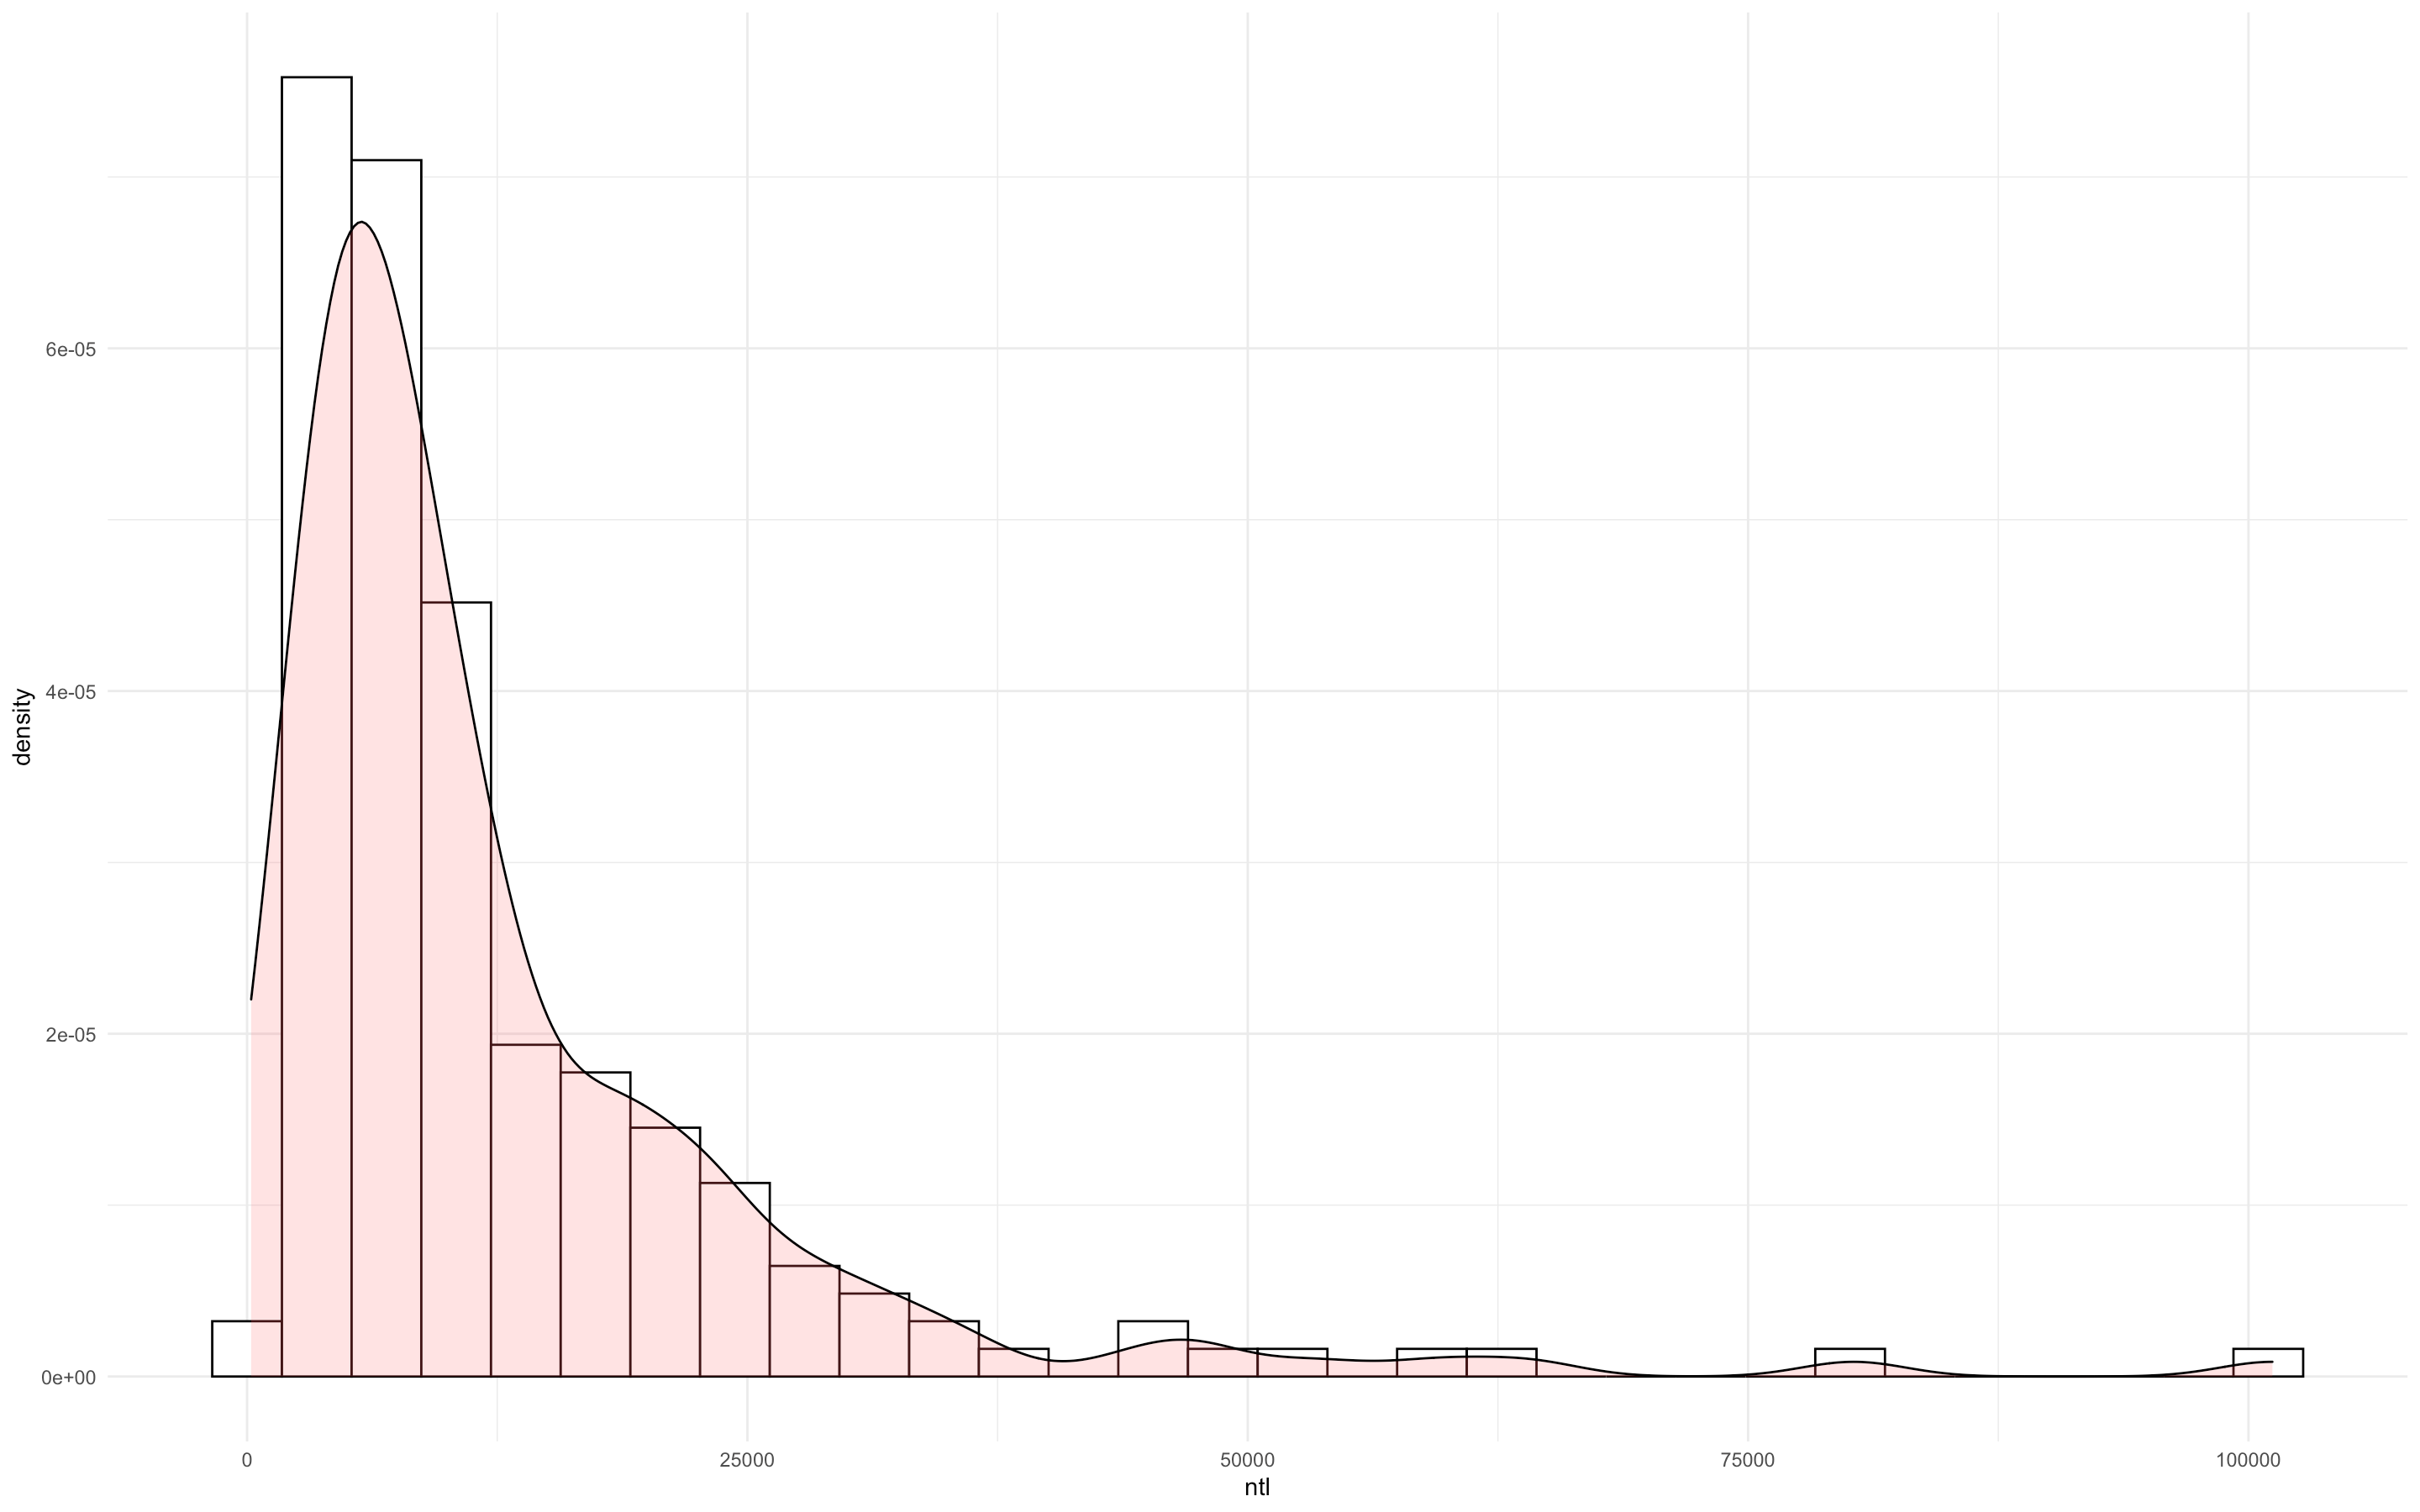
Below are the 4 plots on Cambodia I made for Project #3
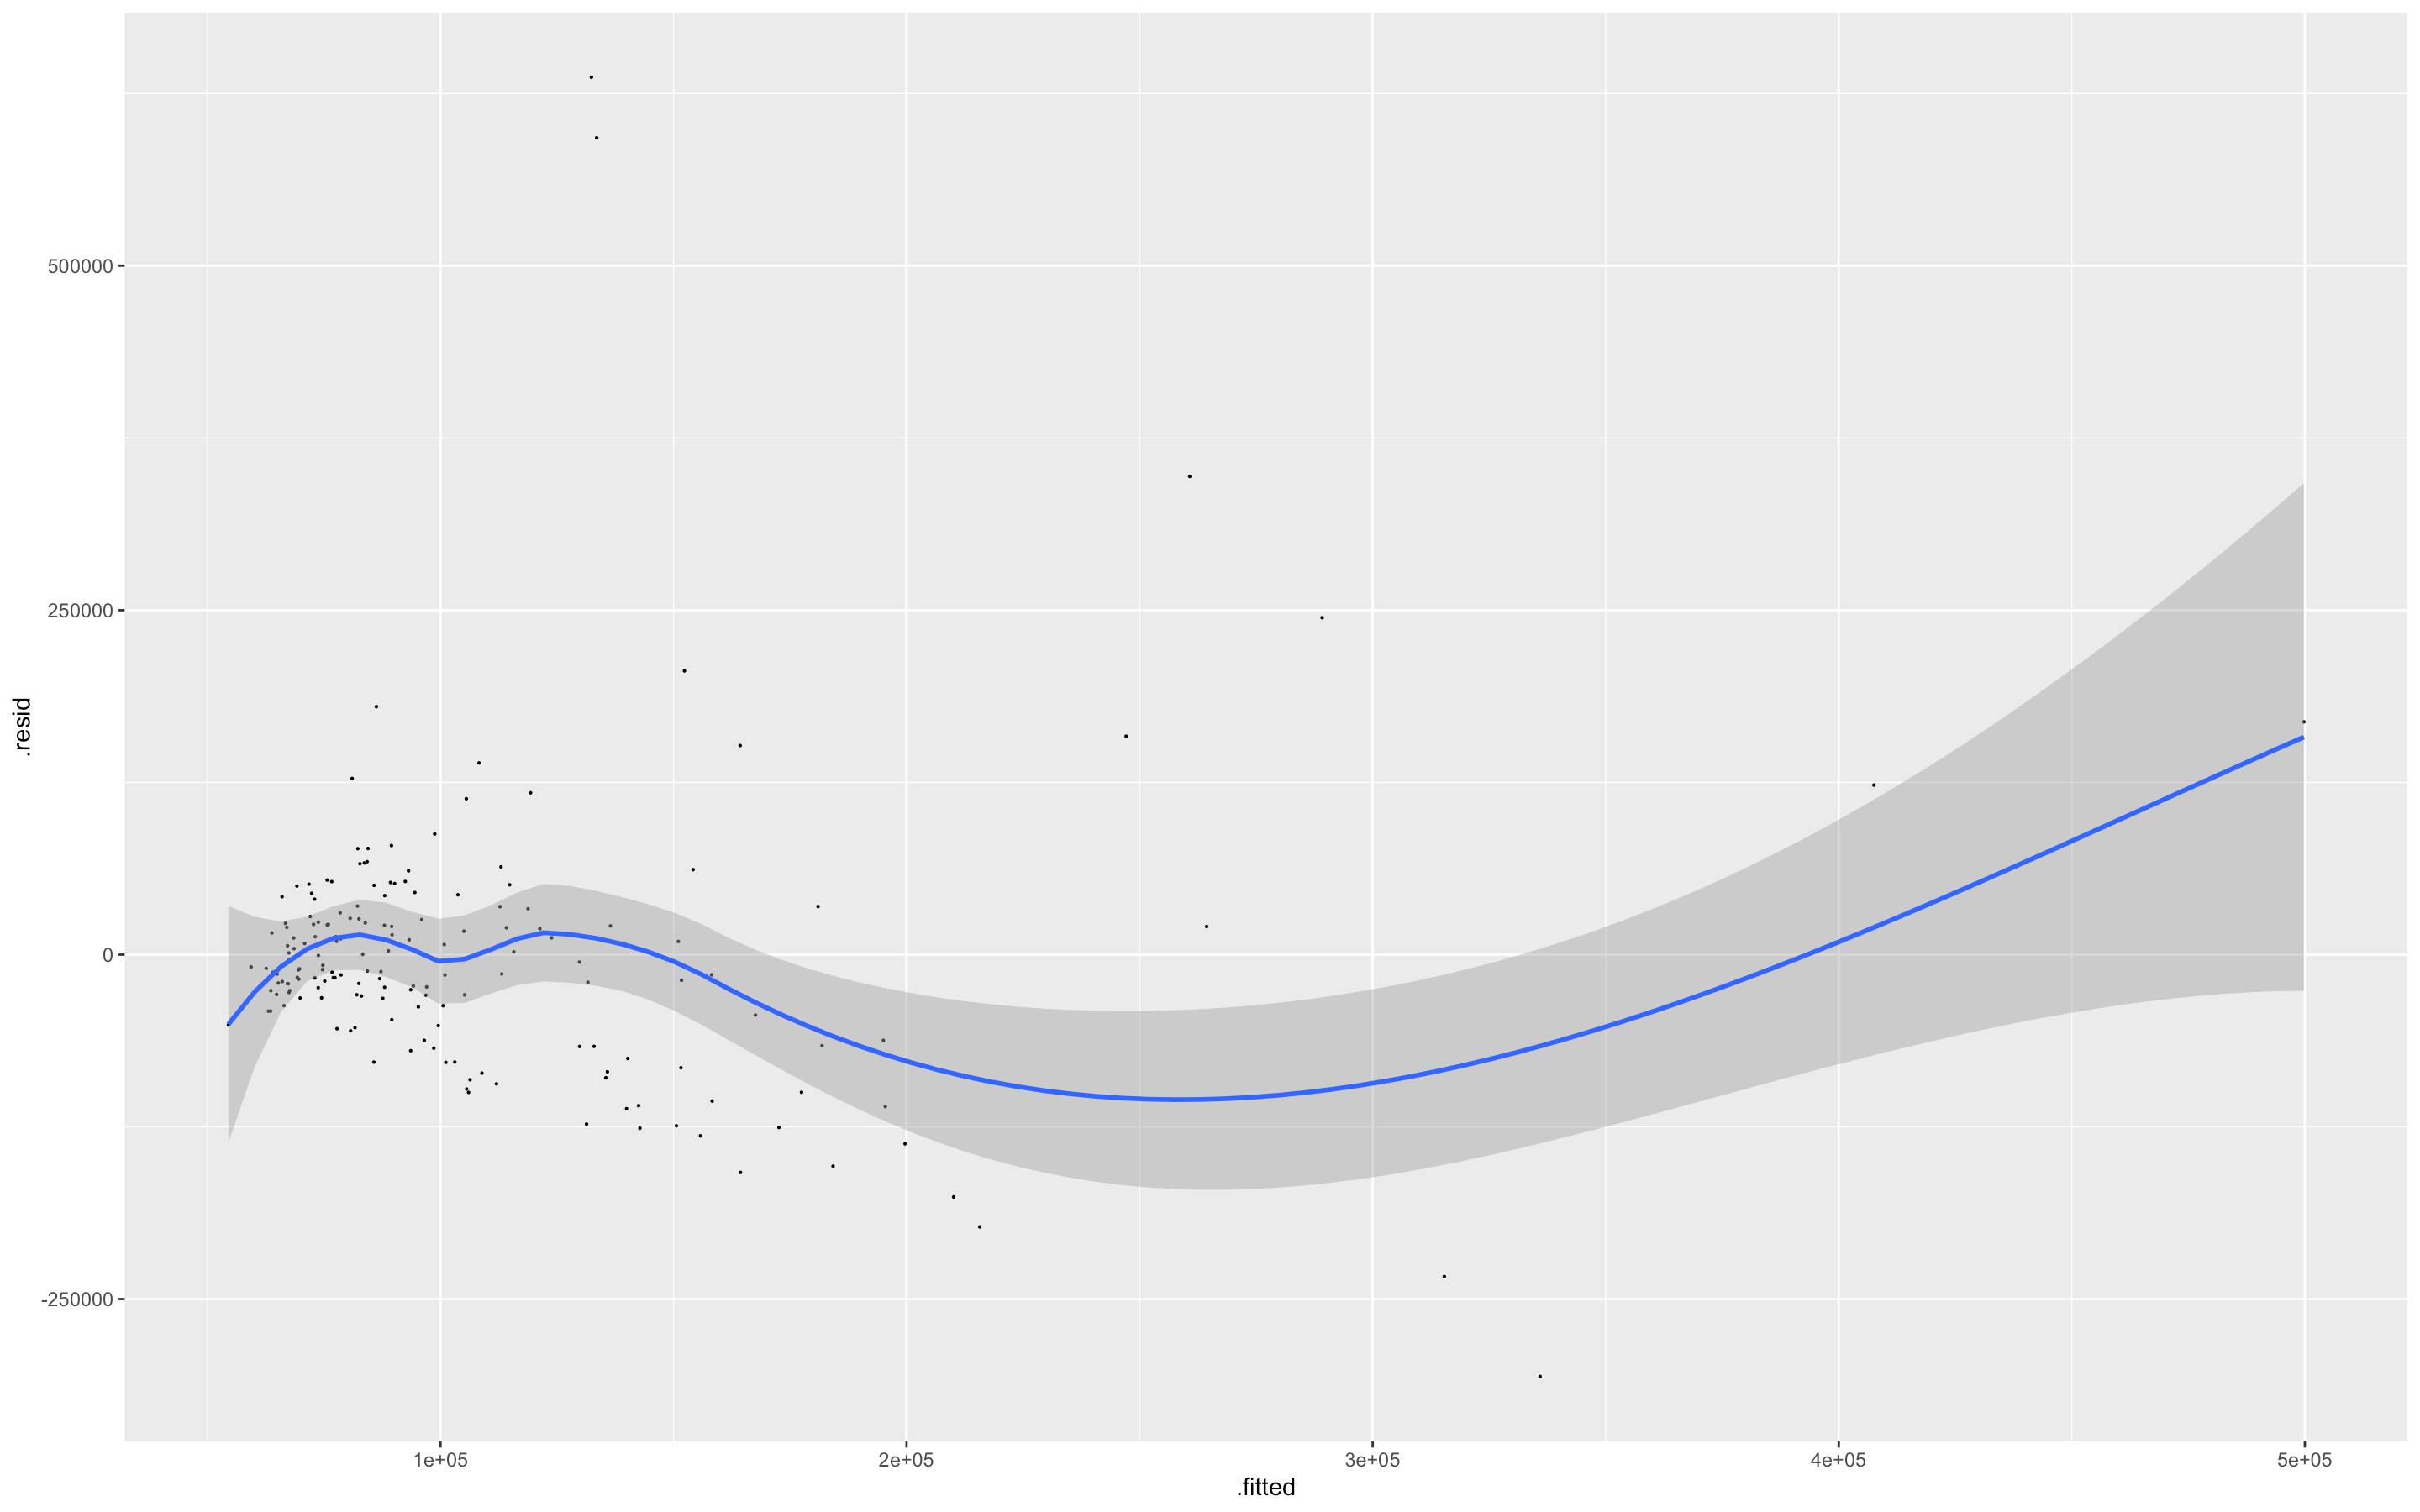
Below are the 4 plots on Cambodia I made for Project #3
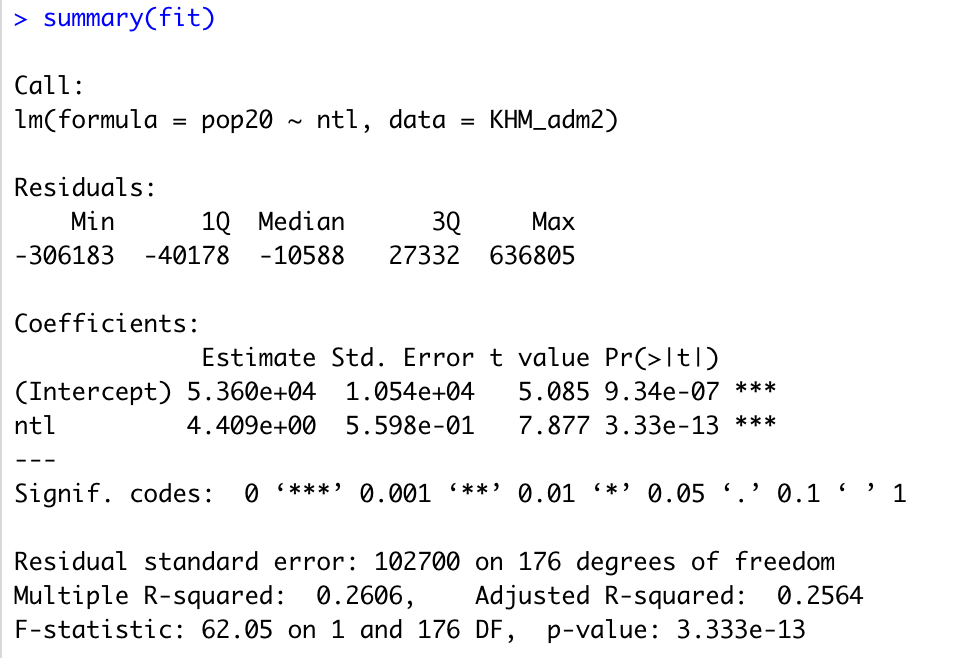
This graph illustrates the relationship between Population and NTL (Night Time Lights)
This graph illustrates the relationship between Population and Water